Moving into the second half of 2021, with the recent update from the feds that interest rate hikes will start kicking in towards the end of 2023, many investors are eager to jump in after staying on the sidelines for a while now. I’ve since decided to collate a list of my top 4 must-buy REITs in the 2H2021. These REITs are my own personal favorites and are picked based on each of their merits which I will share. Without further ado, let’s get started on this list.
Parkway Life REIT
First on my list of must-buy REITs is Parkway Life REIT (SGX: C2PU), one of the largest listed healthcare REITs in Asia with an enlarged portfolio of S$2.75 billion. The REIT is defensive with its long-term lease structures which protects its downside. It also provides a stable stream of income which is supported by regular rental revisions.

As we can see from their portfolio, they are very diversified with properties across 3 key countries in Asia, Singapore, Japan and Malaysia. It’s good to note that they own a total of 49 Freehold properties and 4 Leasehold properties, 3 of which are in Singapore.
Q1 2021 Results
Consistent Growth In Gross Revenue and NPI
| Year on Year Difference | 1Q 2021 | 1Q 2020 |
|---|---|---|
| Gross Revenue | S$29.999 million (+0.4%) | S$29.869 million |
| Net Property Income (NPI) | S$28.029 million (+1.0%) | S$27.746 million |
Parkway Life REIT has once again, posted consistent growth in their Gross Revenue and NPI year over year by 0.4% and 1.0% respectively. Even though the number is small, it is still remarkable that they have managed to grow consistently over so many quarters.
This is why I mentioned that Parkway Life REIT is a very defensive REIT. The best part is, although it is very defensive, its returns are definitely on the higher end of the spectrum, offering investors a pretty attractive risk to reward if they invest in Parkway Life REIT.
Strong Growth In Distributable Income and DPU
| Year on Year Difference | 1Q 2021 | 1Q 2020 |
|---|---|---|
| Distributable Income | S$21.583 million (+3.0%) | S$20.951 million |
| Distributable Income Less Retained Capital | S$21.583 million (+7.4%) | S$20.101 million |
| Distribution Per Unit (DPU) | 3.57 cents (+7.4%) | 3.32 cents |
The Distributable Income segment, as well as DPU, grew much more in comparison by 3.0% and 7.4% respectively. It is good to note that Parkway Life REIT did retain some capital last year due to COVID-19 relief measures. As such, if we were to take that out of the equation, Parkway Life REIT’s Distributable Income would have increased by 7.4%.
Strong Balance Sheet
| As at 31 March 2021 | As at 31 December 2020 | |
|---|---|---|
| Aggregate Leverage | 37.8% | 38.5% |
| Interest Coverage | 20.9x | 18.1x |
| Average Cost of Debt | 0.55% | 0.53% |
Parkway Life REIT’s financials are steady as ever with a very strong interest coverage ratio of 20.9x, an improvement from the quarter prior at 18.1x. They also managed to pay down some of their debt, reducing their aggregate leverage from 38.5% to 37.8%.
They achieved this by issuing 6-year JPY3.3 billion (S$40.1m) 0.51% senior unsecured fixed-rate notes. The proceeds were used to repurchase existing notes that were issued at 0.58%. All in all, they did raise their average cost of debt by 0.02% but it still stood very low at 0.55%.
It is good to note that with Parkway Life REIT’s current gearing of 37.8%, they have a debt headroom of S$269.7m before reaching 45% gearing and $502m before reaching 50% gearing. Not to mention the fact that they can also do an EFR (Equity Fundraising), the sky really is the limit for Parkway Life REIT.
Parkway Life REIT is also the only REIT in Singapore that has not yet done any form of equity fundraising be it rights issues or preferential offerings. Since its IPO in 2007, the number of outstanding units stood at 605.02 million. This is because it did not have a general mandate to issue new units.
5-Year Performance
Revenue Growth
Note : Chart figures are in S$’000
As we can see, the overall 5-year trend for Parkway Life REIT is up. Just to note that Parkway Life REIT had a divestment gain of S$5.39 million in FY2017. This is not reflected in the chart as it is a one-off income item and it will make Parkway Life REIT’s performance seem very inconsistent and inaccurate.
DPU Growth
Note : Chart figures are in S$ cents
Similarly, we can see that the overall DPU trend for Parkway Life REIT is consistently going up. The divestment gains in FY2017 contributed an additional 0.89cents to the DPU for that year. This gain is not added in the chart as they are one-off income items and do not show the real story behind Parkway Life REIT’s performance.
NAV Growth
Note : Chart figures are in S$ dollars
The 5-year trend shows that Parkway Life REIT has managed to grow its NAV/share year on year consistently by 13.95% across the 5 years. This growth comes from the aggressive acquisition and strategic divestments of the Japan assets they own over the years. There were several acquisitions and divestments made every year to help Parkway Life REIT aggressively grow its NAV/share.
It’s also good to note that despite all the acquisitions and divestments, Parkway Life REIT has managed to consistently grow its Gross Revenue, NPI, and DPU, bringing consistent and increasing value to shareholders.
For a much more in-depth analysis on why I picked Parkway Life REIT as one of my must-buy REITs, check out my in-depth analysis here: Is Parkway Life REIT A Good Buy Now?
Ascendas REIT
Second on my list of must-buy REITs is Ascendas REIT (SGX: A17U), Singapore’s first and largest listed business space and industrial REIT. In terms of market capitalization, Ascendas REIT is the largest listed REIT in Singapore right now with a market cap of S$12.37B. Ascendas REIT is a very well-known REIT as you can see its name printed on many industrial buildings in Singapore.

As of 31 December 2020, we can see the Ascendas REIT has a huge portfolio that is very well diversified across 4 countries. They also have about 60% of the portfolio in business parks and data centres which helps the portfolio stay resilient even in times of uncertainty like the COVID-19 pandemic. Another huge benefit of their well-diversified portfolio is the fact that no single property accounts for more than 4.2% of Ascendas REIT’s monthly gross revenue.
FY2020 Results
Strong Growth in Gross Revenue and NPI
| Year on Year Difference | FY2020 | FY2019 |
|---|---|---|
| Gross Revenue | S$1,049.5 million (+13.6%) | S$924.1 million |
| Net Property Income (NPI) | S$776.2 million (+9.4%) | S$709.5 million |
As we can see, Ascendas REIT posted strong growth in Gross Revenue as well as NPI year on year. This is mainly contributed by the newly acquired properties back in December 2019 and 2 properties acquired in November 2020, then partially offset by rent rebates and lower occupancies in certain properties.
Poor DPU as Distributable Income Increases
| Year on Year Difference | FY2020 | FY2019 |
|---|---|---|
| Distributable Income | S$538.4 million (+6.7%) | S$504.4 million |
| Distribution Per Unit (DPU) | 14.688 cents (-6.1%) | 15.638 cents |
Although the Distributable Income increased year on year by 6.7%, the DPU fell due to an enlarged unit base. Even though in the acquisition presentation slides they mentioned that the acquisition is DPU accretive, the rights issue was very well received and was over-subscribed, causing a larger unit base than expected. The new unit base is 13.6% larger than the year before which explains why the DPU fell 6.1%. If we exclude the rollover adjustment (DPU 0.25 cents) in 1Q 2019, the DPU would have decreased by 4.5%.
Strong Balance Sheet
| As at 31 December 2020 | |
|---|---|
| Aggregate Leverage | 32.8% |
| Interest Coverage | 4.3x |
| Average Cost of Debt | 2.7% |
On a brighter note, Ascendas REIT has a very strong and healthy balance sheet. With their very low aggregate leverage of 32.8%, that gives them a huge debt headroom of approximately ~S$5.0B before reaching the cap of 50%. Not to mention their healthy Interest Coverage Ratio of 4.3x and low cost of debt at 2.7%. I feel that it is important for REITs to lower their cost of debt in times like these where interest rates are at all-time lows. It is good to note that Ascendas REIT currently has the highest cost of debt as compared to its peers Keppel Data Centre REIT(1.6%), Mapletree Industrial Trust(2.9%), and Mapletree Logistics Trust(2.2%).
5-Year Performance
Revenue Growth
Note : Chart figures are in millions
As we can see, the overall 5-year trend for Ascendas REIT is up. This is due to the fantastic management that has been aggressively growing the portfolio through meaningful acquisitions as well as Asset Enhancement Initiatives (AEIs). It is not easy for a REIT to be growing so consistently over such a long time frame which makes it even more impressive that Ascendas REIT has done so well.
DPU
Note : Chart figures are in S$ cents
Ascendas REIT has been showing great DPU growth for the past few years taking into account that the number of shares issued is increasing year on year be it through equity fundraising or management fees being paid in units.
As we can see, the DPU did fall in FY2019 and FY2020 due to the enlarged unit base from the recent rights issue from acquisitions. Regardless, I’m still bullish on Ascendas REIT as the acquisition was DPU and NAV accretive while at the same time, decreasing their aggregate leverage by a large margin.
NAV Growth
Note : Chart figures are in S$ dollars
The 5-year trend shows that Ascendas REIT has managed to grow its NAV/share year on year despite the growing unit base. Not to mention the fact that Ascendas REIT is already so huge with such a large unit base so, for them to still be growing is really a commendable feat.
For a much more in-depth analysis on why I picked Ascendas REIT as one of my must-buy REITs, check out my in-depth analysis here: Is Ascendas REIT A Good Buy Now?
Mapletree Commercial Trust
Third on my list of must-buy REITs is Mapletree Commercial Trust (SGX: N2IU), one of the best amongst retail commercial REITs in the Singapore market.
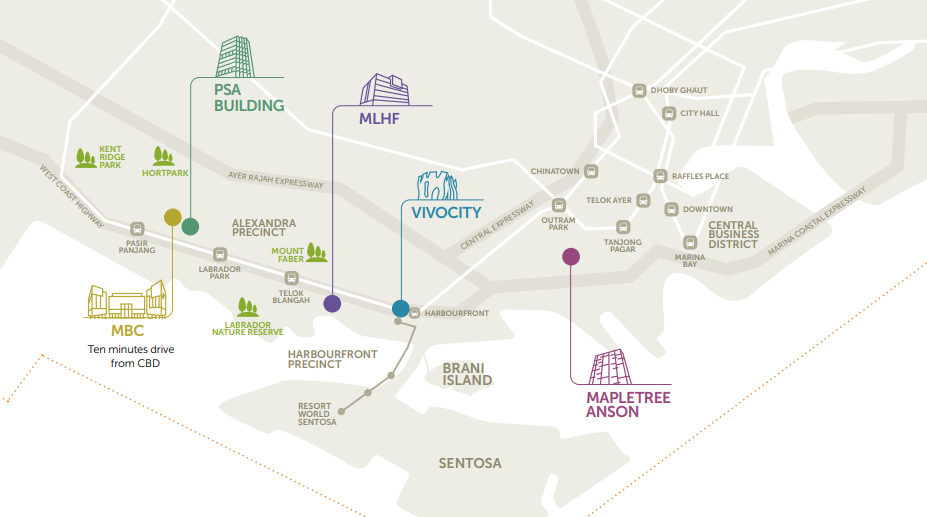
Mapletree Commercial Trust has a total of 5 assets in its portfolio, VivoCity, MLHF, PSA Building, Mapletree Anson, and Mapletree Business City (“MBC”). MBC is split into 2, MBC I and MBC II which together, form one of the largest integrated developments in Singapore, comprising of one office tower and seven business park blocks supported by a retail F&B cluster.
FY20/21 Results
Resilient Performance Despite Poor Market Conditions
| Year on Year Difference | FY20/21 | FY19/20 |
|---|---|---|
| Gross Revenue | S$478.997 million (-0.8%) | S$482.825 million |
| Net Property Income (NPI) | S$377.01 million (-0.2%) | S$377.94 million |
Despite the rough year for commercial and retail REITs due to the pandemic, Mapletree Commercial Trust has managed to do very well thanks to the very resilient portfolio which includes their newly acquired MBC II. The Gross Revenue and NPI fell marginally by 0.8% and 0.2% respectively year on year. As compared to its peers, which have seen a much deeper drop in terms of performance, it goes to show how strong MCT’s portfolio is.
Strong Growth in Distributable Income and DPU
| Year on Year Difference | FY20/21 | FY19/20 |
|---|---|---|
| Distributable Income | S$314.72 million (+29.4%) | S$243.218 million |
| Distribution Per Unit (DPU) | 9.49 cents (+18.6%) | 8.00 cents |
On top of the resilient performance, they have managed to increase their Distributable Income and DPU substantially by 29.4% and 18.6% respectively. This is mainly due to the lower base set last year as MCT retained a total of S$43.7m in capital distribution to conserve liquidity in view of the pandemic. On top of that, the contributions from MBC II not only provided stability but strong growth to the overall portfolio.
Resilient Balance Sheet
| As at 31 March 2021 | As at 31 December 2020 | As at 31 March 2020 | |
|---|---|---|---|
| Aggregate Leverage | 33.9% | 34.0% | 33.3% |
| Interest Coverage | 4.4x | 4.2x | 4.3x |
| Average Cost of Debt | 2.48% | 2.51% | 2.94% |
Coupled with the strong set of results for FY20/21, Mapletree Commercial Trust has also maintained a relatively stable balance sheet with a conservative aggregate leverage of 33.9% and an interest coverage ratio of 4.4x. On top of that, MCT has also managed to bring down its average cost of debt from 2.94% the year prior to 2.48%. To put it in perspective, for every 25 bps (0.25%) change in Swap Offer Rate, it is estimated to impact the DPU by 0.06 cents. This means that the drop in the cost of debt has positively impacted the DPU by 0.1104 cents.
Portfolio Occupancy

Taking a look at MCT’s portfolio, we can see that the Occupancy Rates have been holding stable with VivoCity’s occupancy slowly recovering back to pre-covid levels. MBC I and mTower’s occupancy rate has been improving consistently as well so we can definitely expect a much stronger 1H FY21/22 for MCT. It is good to note that thanks to MBC II, Mapletree Anson and MLHF, the overall portfolio is very resilient, allowing MCT to perform much better than its peers.
5-Year Performance
After looking into Mapletree Commercial Trust’s portfolio, we will take a deep dive into its past performance and see if the REIT has managed to perform well over the last 5 years.
Revenue Growth
Note : Chart figures are in millions
Starting off with revenue growth, we can see that Mapletree Commercial Trust has been able to grow its Gross Revenue, NPI as well as Distributable Income consistently year over year with the exception of FY19/20 which is partially affected by the Covid-19 pandemic. This is why the Distributable Income fell year over year for FY19/20 as the REIT decided to retain some capital. Looking at FY20/21, MCT bounced back stronger with a much better set of results thanks to the recovery of the overall market.
DPU
Note : Chart figures are in S$ cents
Next up, one of the most important metrics to look at when analyzing a REIT, the Distribution Per Unit or DPU. We can see that Mapletree Commercial Trust has managed to grow its DPU year over year over the last 5 years with the exception of FY19/20 as the REIT retained some of its distributable income. It is also great to see that when you compare each half year over year, you can also see meaningful and consistent growth. Similarly, MCT’s FY20/21 results definitely proved to investors how resilient they are, not only improving from FY19/20’s DPU but FY18/19’s DPU as well.
NAV Growth
Note : Chart figures are in S$ dollars
Lastly, we also want to see NAV/Share growth because of 2 key reasons. Firstly, we don’t want a REIT that simply dilutes its shareholders by issuing an obscene amount of shares just to do an acquisition every time. Secondly, based on the theory/assumption that a REIT will always trade near its book value, meaning at a PB ratio of 1, we can see meaningful capital appreciation if the REIT can grow its NAV/Share consistently year over year.
As we can see, Mapletree Commercial Trust has managed to grow its NAV/Share meaningfully and consistently year over year with the exception of a small dip in FY20/21 due to the higher base set in FY19/20 as MCT retained some capital in view of the uncertain pandemic situation.
For a much more in-depth analysis on why I picked Mapletree Commercial Trust as one of my must-buy REITs, check out my in-depth analysis here: Is Mapletree Commercial Trust A Good Buy Now in 2021?
Frasers Centrepoint Trust
Last but not least on my list of must-buy REITs is Frasers Centrepoint Trust (SGX: J69U), another very well-known REIT amongst Singapore REIT investors. They own a portfolio of heartland retail malls in Singapore such as Causeway Point, Anchorpoint, Waterway Point, etc. They differ from Capitaland Mall Trust due to the nature of their assets. CMT owns malls that are around the town/central area as well as some heartland malls.

As of 31 March 2021, we can see that Frasers Centrepoint Trust has a very strong portfolio with well-populated malls in Singapore’s suburban area. On top of this, they also have an office asset (Central Plaza).
It is good to note that since the release of the 2H2021 results, the management has been very active in rejuvenating the overall portfolio with some divestments. On top of the recently divested Bedok Point as well as Anchopoint Shopping Centre, as of 28 May 2021, Frasers Centrepoint Trust has successfully completed the divestment of YewTee Point, which has been underperforming while a while now.
It is always good to see a REIT’s management being so active in rejuvenating and improving the overall portfolio, not only through acquisitions but also through meaningful divestments as well. Although FCT will see slight decreases in their overall revenue and DPU due to the reduced number of assets, I believe that the divestments were necessary to help FCT be prepared for any accretive opportunities that may come by.
1H2021 Results
Strong Recovery In Gross Revenue and NPI
| Year on Year Difference | FY2021 | FY2020 |
|---|---|---|
| Gross Revenue | S$341.15 million (+107.5%) | S$164.38 million |
| Net Property Income (NPI) | S$246.57 million (+122.4%) | S$110.89 million |
With retail REITs being hit the hardest last year due to the pandemic, the base was set pretty low and as such, the huge recovery in terms of Gross Revenue and NPI. If we were to compare it to 1H2019 (pre-pandemic), we can see that FCT grew its Gross Revenue and NPI by a large margin as well, from $99.014m and $71.831m, representing a growth of 75.3% and 74.9% respectively.
Although the numbers look good, It is good to note that this comparison is not very meaningful because FCT was a lot smaller back then with only 6 properties to its name as compared to now with 10 properties.
All in all, this is definitely a good sign that the retail REITs are recovering well with the economy and we can expect an even better 2H2021 with the full contribution from the newly acquired ARF assets.
Phenomenal Recovery In Distributable Income and DPU
| Year on Year Difference | FY2021 | FY2020 |
|---|---|---|
| Distributable Income | S$204.67 million (+102.4%) | S$101.15 million |
| Distribution Per Unit (DPU) | 12.085 cents (+33.7%) | 9.042 cents |
Similarly, because of the low base set from last year, the Distributable Income grew by 42.3% while the DPU grew by 28.4%. The table above shows 2 sets of DPUs because the upcoming distribution for shareholders is only 5.864 cents instead of the reported 5.996 cents. This is because the missing 0.132 cents were accrued prior to the new FCT units being issued and has already been paid out to shareholders on 4th December.
With the new ARF assets only contributing to 5 months’ worth instead of 6 full months, we can expect a much stronger recovery in 2H2021 with potential growth in DPU not only year on year but half on half as well.
Maintained A Strong Balance Sheet
| As at 30 September 2021 | As at 31 March 2021 | |
|---|---|---|
| Aggregate Leverage | 33.3% | 35.2% |
| Interest Coverage | 5.11x | 5.04x |
| Average Cost of Debt | 2.2% | 2.2% |
Although it has been a rough year for FCT, they managed to maintain their aggregate leverage at a comfortable range post-arf acquisition at around 35.2%, a slight increase from last year’s 34.7%. They also maintained a relatively high-interest coverage ratio of 5.04x. The most important factor is the fact that they managed to drop their average cost of debt from 2.5% to a low 2.16%.
Just to put it into perspective, FCT’s total debt outstanding stands at S$2,015.6 million. This means that for every 0.01% drop in the cost of debt, FCT saves an approximate S$0.2 million. With the cost of debt dropping from 2.5% to 2.16%, this represents a drop of 0.34% or an estimated savings of S$6.853 million or 0.403 cents in terms of DPU.
Overview on Portfolio Stability
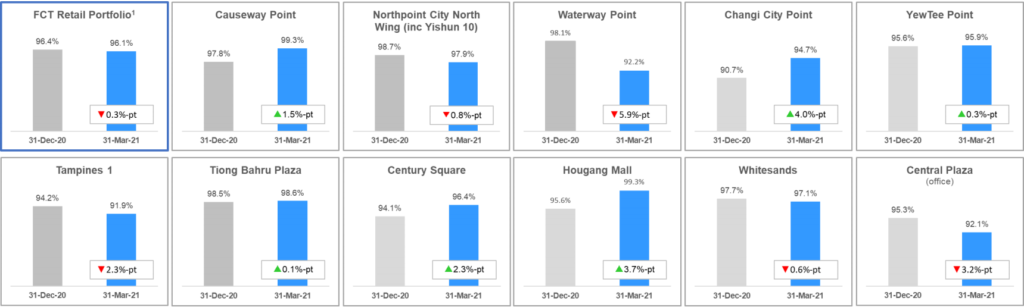
Last but not least, taking a deep dive into FCT’s overall portfolio, the occupancy rate fell by 0.3% to 96.1%. Looking at the individual assets, we can see that the occupancy rate improved across some of the assets like Causeway Point, Changi City Point, YewTee Point, Tiong Bahru Plaza, Century Square as well as Hougang Mall. Amongst the assets that saw a drop in occupancy rates, only Waterway Point and Central Plaza (Office) saw the biggest drop of 5.8% and 3.2% respectively.

Moving onto the leases across each asset, we can see that half of the assets actually saw positive YTD rental reversion. The key dips were from Changi City Point (-10.5%), Century Square (-5.7%) as well as Hougang Mall (-4.9%), and Tiong Bahru Plaza (-4.4%). The only meaningful asset that dipped was Changi City Point because the number of renewals/new leases (30) made up to 19% of the entire mall whereas the others only had a small percentage of the mall (< 5%) with negative YTD rental reversion.
5-Year Performance
Revenue Growth
Note : Chart figures are in S$’000
As we can see, the overall 5-year trend for Frasers Centrepoint Trust is up. This is due to the fantastic management that has been aggressively growing the portfolio through meaningful acquisitions and investments over the years. The Gross Revenue has been shaky across the years but the NPI and Distributable Income has consistently gone up over the past 5 years.
There is a huge dip in FY2020 due to the covid-19 pandemic which heavily impacted the overall economy and retail sector. Taking aside the one-off black swan event, we can see that FCT has been doing well over the past few years and is set to continue that trend with its recent acquisition of the PGIM ARF portfolio.
Read Also: Frasers Centrepoint Trust Increased Their Stake In PGIM ARF! What Does This Mean?
DPU
Note : Chart figures are in S$ cents
Similarly, Frasers Centrepoint Trust has a very strong track record of consistently rewarding shareholders with increasing DPU over the past 5 years, excluding FY2020. If not for the pandemic, we would be set to see a continued increase in DPU post-ARF acquisition.
NAV Growth
Note : Chart figures are in S$ dollars
The 5-year trend shows that Frasers Centerpoint Trust has managed to grow its NAV/share year on year consistently and at a relatively fast pace as well. This is very important because some REITs tend to see heavy dilution when doing acquisitions which results in shareholders indirectly losing value.
As such, investors can use the NAV/share as well as DPU/share as indicators to determine if a REIT is truly bringing shareholders, increased value with acquisitions or are they only doing that “on paper”.
For a much more in-depth analysis on why I picked Frasers Centrepoint Trust as one of my must-buy REITs, check out my in-depth analysis here: Is Frasers Centrepoint Trust A Good Buy Now in 2021?
Final Thoughts
All 4 REITs mentioned in this article are must-buy REITs to me based on the current situation, with the global economy kickstarting its recovery back to pre-pandemic levels. These REITs are definitely well positioned to do very well as the economy recovers post-pandemic. If you were to invest in these 4 REITs, you are well positioned for any situation that could come, be it a second or third wave of covid-19 cases or perhaps a much faster recovery on the economy.
With the stability and defensive nature of Parkway Life REIT and Ascendas REIT, you can sleep well at night, fully knowing that their overall business is not affected and they can continue to increase their DPU year on year. On top of that, with Frasers Centrepoint Trust and Mapletree Commercial Trust, you can leverage on the post-pandemic recovery of the economy.