Frasers Centrepoint Trust (SGX: J69U) is Singapore’s biggest player in the suburban retail space now with 10 quality retail malls focused on providing Essential Services to mainly domestic catchment. As suburban malls were among the first to benefit from the post-pandemic recovery, investors are now thinking if Frasers Centrepoint Trust (FCT) is a good investment while we continue to ride on the recovery wave back to pre-pandemic levels.
As the FY2021 results are just released, let’s take a deep dive into Frasers Centrepoint Trust’s track record, portfolio performance, and long-term growth catalysts as well as risks that investors should know about before investing.
Portfolio Overview

As of 30 September 2021, we can see that Frasers Centrepoint Trust has a very strong portfolio with well-populated malls in Singapore’s suburban area. On top of this, they also have an office asset (Central Plaza).
Since the release of the 2H2020 results, the management has been very active in rejuvenating the overall portfolio with some divestments. On top of the recently divested Bedok Point as well as Anchopoint Shopping Centre, as of 28 May 2021, Frasers Centrepoint Trust has successfully completed the divestment of YewTee Point, which has been underperforming while a while now.
It is always good to see a REIT’s management being so active in rejuvenating and improving the overall portfolio, not only through acquisitions but also through meaningful divestments as well. Although FCT will see slight decreases in their overall revenue and DPU due to the reduced number of assets, I believe that the divestments were necessary to help FCT be prepared for any accretive opportunities that may come by.
FY2021 Results
Strong Recovery In Gross Revenue and NPI
| Year on Year Difference | FY2021 | FY2020 |
|---|---|---|
| Gross Revenue | S$341.15 million (+107.5%) | S$164.38 million |
| Net Property Income (NPI) | S$246.57 million (+122.4%) | S$110.89 million |
With retail REITs being hit the hardest last year due to the pandemic, the base was set pretty low and as such, the huge recovery in terms of Gross Revenue and NPI. Gross Revenue and NPI grew significantly by 107.5% and 122.4% year on year respectively. This is mainly due to the ARF acquisition which contributed to approximately 11 months instead of a full 12 months for FY2021. 2H2021 performed slightly lower than 1H2021 due to rental rebates given out under the Government’s “Rental Waiver Framework”, additional tenant assistance provided as well as the loss of contribution from divested properties during the period.

Across FCT’s portfolio, the remaining 4 assets that FCT has held since FY2020, have improved year over year in terms of Gross Revenue and NPI. As for the 6 newly acquired assets, since they were just acquired, there is no meaningful comparison with the year prior.
Phenomenal Recovery In Distributable Income and DPU
| Year on Year Difference | FY2021 | FY2020 |
|---|---|---|
| Distributable Income | S$204.67 million (+102.4%) | S$101.15 million |
| Distribution Per Unit (DPU) | 12.085 cents (+33.7%) | 9.042 cents |
Similarly, because of the low base set from last year, the Distributable Income and DPU followed suit, growing by 102.4% and 33.7% year on year respectively. Despite the enlarged unit base, FCT still managed to achieve huge growth in its DPU for FY2021.
Maintained A Strong Balance Sheet
| As at 30 September 2021 | As at 31 March 2021 | |
|---|---|---|
| Aggregate Leverage | 33.3% | 35.2% |
| Interest Coverage | 5.11x | 5.04x |
| Average Cost of Debt | 2.2% | 2.2% |
FCT’s balance sheet is very healthy with a gearing of 33.3%, a significant drop from 6 months ago at 35.2%. Its ICR has also improved from 5.04x to 5.11x over the same period while the average cost of debt remained the same at 2.2%. Just to put it into perspective, FCT’s total debt outstanding stands at S$1.815 billion. This means that for every 0.01% drop in the cost of debt, FCT saves approximately S$0.1815 million if they continue to lower their cost of debt over the next few quarters.
Overview on Portfolio Stability

Last but not least, taking a deep dive into FCT’s overall portfolio, the overall Portfolio Occupancy has also improved by 0.9% to 97.3%, with the main contribution coming from Waterway Point (+4.6%), Tiong Bahru Plaza (+2.0%) as well as Central Plaza (+0.9%) which was slightly offset by Tampines 1 (-2.1%) and White Sands (-0.9%).

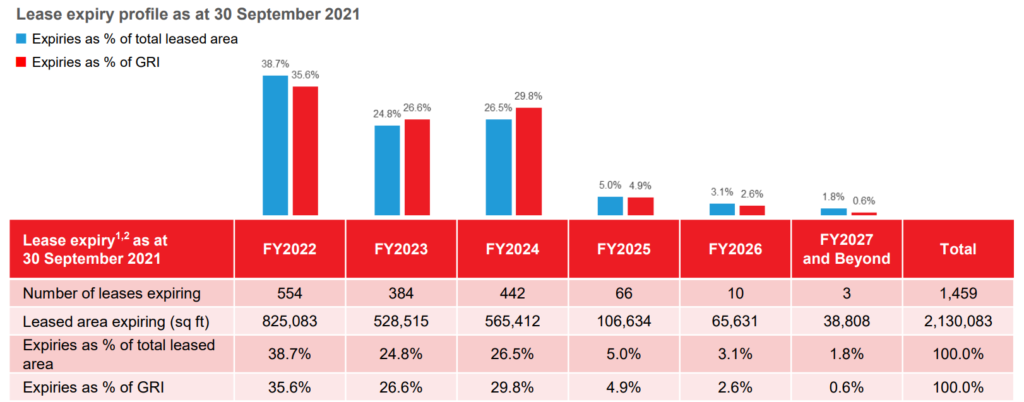
FCT’s overall portfolio WALE stands at 1.64 years in terms of NLA, a slight improvement from last quarter’s 1.62 years and, 1.64 years in terms of Gross Rental Income (GRI), also a slight improvement from last quarter’s 1.63 years. It is good to note that leases expiring in FY2022 accounts for approximately 35.6% of GRI and 38.7% of NLA. Despite the big percentage expiring next year, I am confident in FCT’s management to not only renew but also acquire new tenants if current ones are churned out.

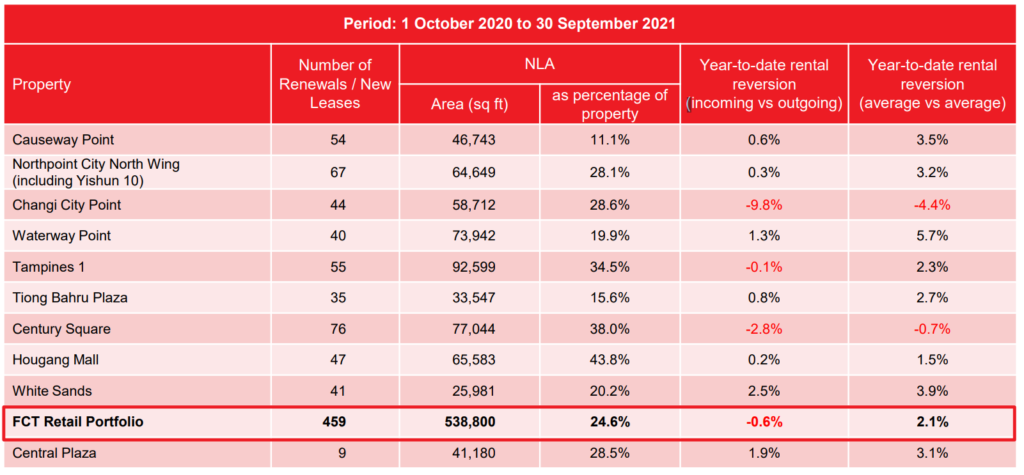
As for FCT’s portfolio rental reversion, we can see that when we compare incoming vs outgoing leases, FCT saw a -0.6% year to date rental reversion with Changi City Point (-9.8%) and Century Square (-2.8%) being the main assets that pulled down the rental reversion. If we compare the average vs average, we can see that FCT saw a 2.1% year-to-date rental reversion with Waterway Point (+5.7%), White Sands (+3.9%), and Causeway Point (+3.5%) positively contributing to the rental reversion.
5-Year Performance
Revenue Growth
Note: Chart figures are in S$’000
As we can see, the overall 5-year trend for Frasers Centrepoint Trust is up. This is due to the fantastic management that has been aggressively growing the portfolio through meaningful acquisitions and investments over the years. The Gross Revenue has been shaky across the years but the NPI and Distributable Income has consistently gone up over the past 5 years.
There is a huge dip in FY2020 due to the covid-19 pandemic which heavily impacted the overall economy and retail sector. Taking aside the one-off black swan event, we can see that FCT has been doing well over the past few years and has performed well in FY2021 thanks to the acquisition of PGIM ARF.
Read Also: Frasers Centrepoint Trust Increased Their Stake In PGIM ARF! What Does This Mean?
DPU
Note: Chart figures are in S$ cents
Similarly, Frasers Centrepoint Trust has a very strong track record of consistently rewarding shareholders with increasing DPU over the past 5 years, excluding FY2020. With the fantastic acquisition of PGIM ARF this year, FCT has managed to bounce back from FY2020 lows to an even higher DPU now, beating the FY2019 (pre-covid) DPU.
NAV Growth
Note: Chart figures are in S$ dollars
The 5-year trend shows that Frasers Centerpoint Trust has managed to grow its NAV/share year on year consistently and at a relatively fast pace as well. This is very important because some REITs tend to see heavy dilution when doing acquisitions which results in shareholders indirectly losing value.
As such, investors can use the NAV/share as well as DPU/share as indicators to determine if a REIT is truly bringing shareholders, increased value with acquisitions or are they only doing that “on paper”.
Potential Growth Catalysts
Moving forward, investors should definitely consider if Frasers Centrepoint Trust has any potential growth catalysts left after the PGIM ARF portfolio acquisition. If not, this would mean that the REIT will start to stagnant and might not be as great of an investment as you think. Let’s cover a few potential growth catalysts that FCT might see in the near term as well as long term that can help grow the REIT.
Acquisitions From Sponsor Pipeline and 3rd Parties
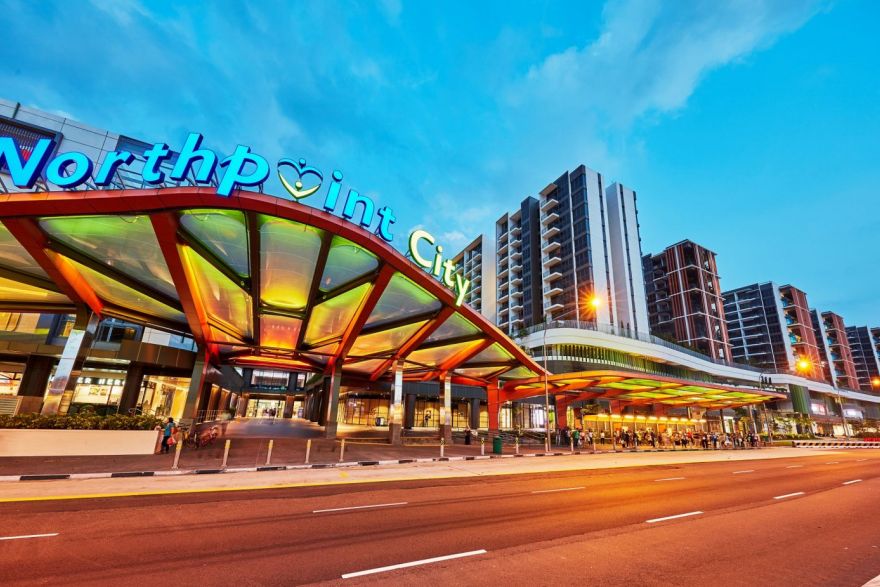
As of 30 September 2021, aside from Frasers Centrepoint Trust’s main portfolio, they also own a 40% stake in Sapphire Star Trust (“SST”), a private trust that owns Waterway Point, a suburban shopping mall located in Punggol. They also hold 31.15% of the units in Hektar Real Estate Investment Trust (“H-REIT”). H-REIT, an associate of FCT, is a retail-focused REIT in Malaysia listed on the Main Market of Bursa Malaysia Securities Berhad. Its property portfolio comprises Subang Parade (Selangor), Mahkota Parade (Melaka), Wetex Parade (Johor), Central Square (Kedah), Kulim Central (Kedah) and Segamat Central (Johor). FCT’s sponsor pipeline also includes Northpoint City South Wing, which is owned by Frasers Property and the TCC Group.

Among these potential acquisitions, the most likely will be Northpoint City South Wing from FCT’s sponsor pipeline. It is also likely for FCT to acquire a larger stake or even fully acquire SST, thus acquiring Waterway Point. FCT’s stake in H-REIT is likely to stay as is because the Malaysian retail sector has yet to see any forms of recovery and it might stay this way for an additional 12-18 months depending on how fast Malaysia recovers from the pandemic. With the country being hit hard by the pandemic, it could be a poor investment for FCT as compared to its other choices here in Singapore.
As of 30 September 2021, FCT’s gearing stood at 33.3%. With such a low gearing ratio, FCT has a debt headroom of approximately ~S$1.25b before reaching a gearing of 45% and ~S$1.97b before reaching a gearing of 50%. With its increased size from the PGIM ARF acquisition combined with the low gearing, it is fairly easy for FCT to announce an acquisition with minimal dilution.
Asset Enhancement Initiatives
As usual, with all REITs, Asset Enhancement Initiatives (AEIs) are the most common and easiest way for the management to grow its portfolio without causing any dilution to shareholders. On the flip side, AEIs cannot really be anticipated or predicted because we don’t know which part of the portfolio and which specific asset can be further enhanced or improved.
Additionally, AEIs might sometimes require the asset to be left untenanted until it is completed. This could temporarily decrease the asset’s NPI and ultimately impact the portfolio’s performance. As such, investors should always look through the AEIs being done to understand the impacts that they will have on the overall REIT. In most cases, the AEIs tend to be accretive in one way or another, such as increasing the total NLA of the asset or improving the overall asset’s facilities to attract more tenants. The AEIs are usually found in the bottom section of every REIT’s business update or results presentation slides, in addition to the rationale for the AEI and expected completion date.
With the overall retail market looking weak and FCT having seen a drop in its occupancy rate across its assets in the past quarter, this could be the prime time for them to do AEIs while there is some time and a huge runway for recovery.
Valuation
Of course, before we invest in any company, we should always do it at the right price and valuation. Let’s take a look at Frasers Centrepoint Trust’s current valuation based on its closing price today.
| PB Ratio | Annualized Dividend Yield | |
|---|---|---|
| Frasers Centrepoint Trust ($2.36) | 1.03x | 5.121% |
As we can see, Frasers Centrepoint Trust is relatively fair valued with a PB ratio of 1.03x and an annualized dividend yield of 5.121%. When compared to FCT’s 5-year historical average PB ratio of 1.09 and dividend yield of 4.93%, FCT is also seen to be pretty fair valued.
Valuation v. Peers
| Frasers Centerpoint Trust's Peers | PB Ratio | Annualized Dividend Yield |
|---|---|---|
| CapitaLand Integrated Commercial Trust ($2.15) | 1.08x | 4.819% |
| Lendlease REIT ($0.885) | 1.09x | 5.288% |
| SPH REIT ($1.03) | 1.13x | 5.243% |
| Starhill Global REIT ($0.64) | 0.81x | 6.172% |
As compared to its peers like CapitaLand Integrated Commercial Trust, Lendlease REIT, SPH REIT, and Starhill Global REIT, we can see that Frasers Centrepoint Trust is actually trading a slight discount as compared to its peers. Other than Starhill Global REIT, all the other REITs are priced at a much higher premium as compared to FCT in terms of its PB ratio. When comparing the annualized dividend yield, we can see that FCT is near the average amongst its peers.
Final Thoughts
Frasers Centrepoint Trust has definitely been one of the key REITs that I have been monitoring for a long time now. Since FY2020 after I predicted the PGIM ARF portfolio acquisition, I accumulated FCT in 2 tranches, the first at 2.59 and the second during the Preferential Offering (PO) at 2.34. Since then, I have not sold any shares, neither have I accumulated more due to portfolio sizing and using the capital on better opportunities in the market.
My long-term price target is way beyond $3 as per most analysts’ price target and that there is a huge upside for FCT. The enhanced portfolio combined with the recovery of the economy back to pre-covid levels will definitely bring FCT to greater heights, way beyond its past highs. On top of that, the improved DPU adds a nice layer of icing on top of the already sweet and tasty cake.
Pingback: REIT Posts of the Week @ 6 November 2021 | TheFinance.sg