The moomoo app isn’t just for new investors who are just starting out but also, for the more experienced investors and traders as well. The moomoo app has in-depth technical features as well that can help you with high-frequency trading as well as timing your entry and exits in the market. If you are a trader looking for a platform with in-depth features to help you maximize profits, take a look at the moomoo app.
Finding Stocks To Trade

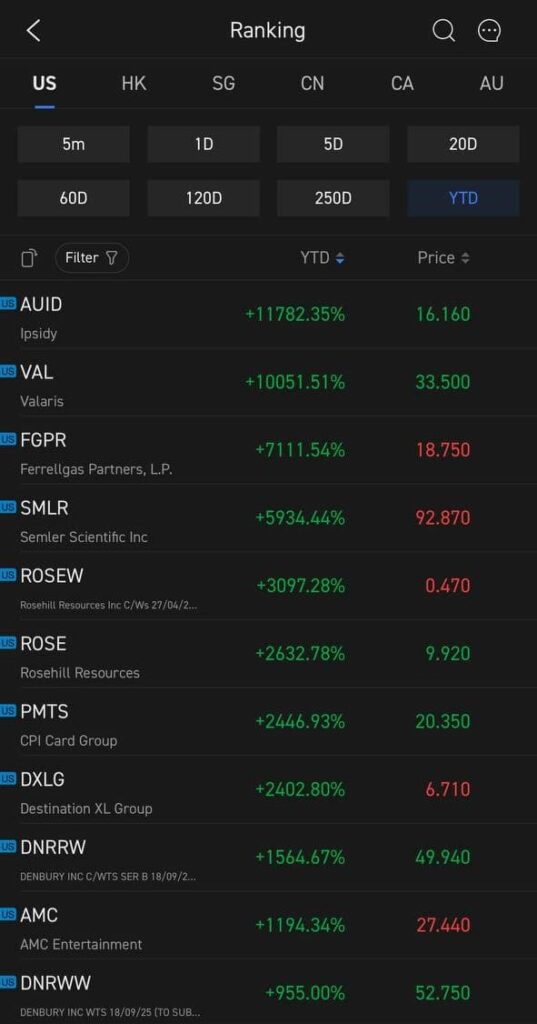
As a trader, it is always a hassle to find the top trading stocks with the strongest volume to take advantage of. You will need to use multiple screeners and look through each and every stock. With the moomoo app, you can simply use the Stock Ranking feature, found under the “Explore” page. The data is based on Futu’s big data computing capabilities and it displays the rise and fall rankings of all stocks in different time intervals across six markets Singapore, US stocks, Hong Kong stocks, Shanghai and Shenzhen, Canada, and Australia. Investors can choose 5 minutes, 5, 10, 20, 60, 120, or 250 days, within 1 year, etc. multiple interval dimensions. Currently, both the Canadian and Australian markets are not tradable via moomoo app yet.
Access To In-depth Information
Being a retail investor and trader, it can be hard to gain access to important information such as short sell data and order flow. With the moomoo app, all these will be readily available at your fingertips.
Short Selling Data
A stock that has a lot of short-sale trading volume reflects that investors are bearish on the stock price in the market outlook. If the short-sale volume of a stock rises sharply, it means that a large number of funds expect the stock price to fall. The number of short-sell per day can be used to identify the short power in the market and assist investment decision-making.

As mentioned, the moomoo app gives investors and traders access to short-selling data. The short-sale data is updated daily whereas most other brokers update once every half a month. moomoo is one of the first online brokerage to support daily short-selling data on US stocks. According to the daily short-sale data, investors and traders can easily identify the long-short sentiment in the market and judge the stock price trend in the market outlook.
AI Monitor

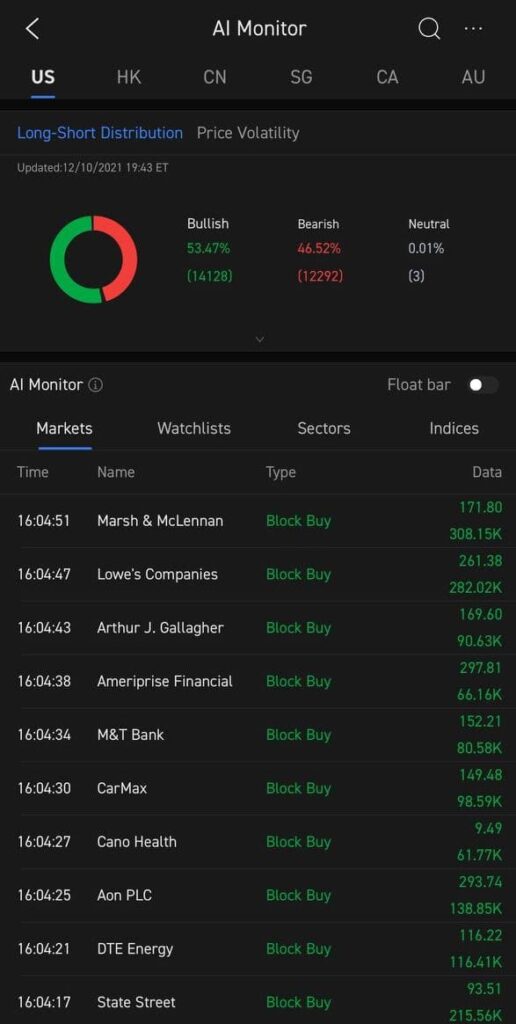
Another exciting feature in the moomoo app is the AI Monitor which helps investors monitor the changes in each market as well as stocks in their own watchlist. This feature is completely automated and covers 6 key markets namely being the US, HK Shanghai, Shenzhen, Singapore, Canada, and Australia. Currently, both the Canadian and Australian markets are not tradable via moomoo app yet. The smart pegging function mainly monitors the real-time changes in the market, without manual pegging. The system automatically helps investors monitor the changes in various markets and all stocks they choose to find more investment opportunities thus making investment decisions easier.
Technical Charting

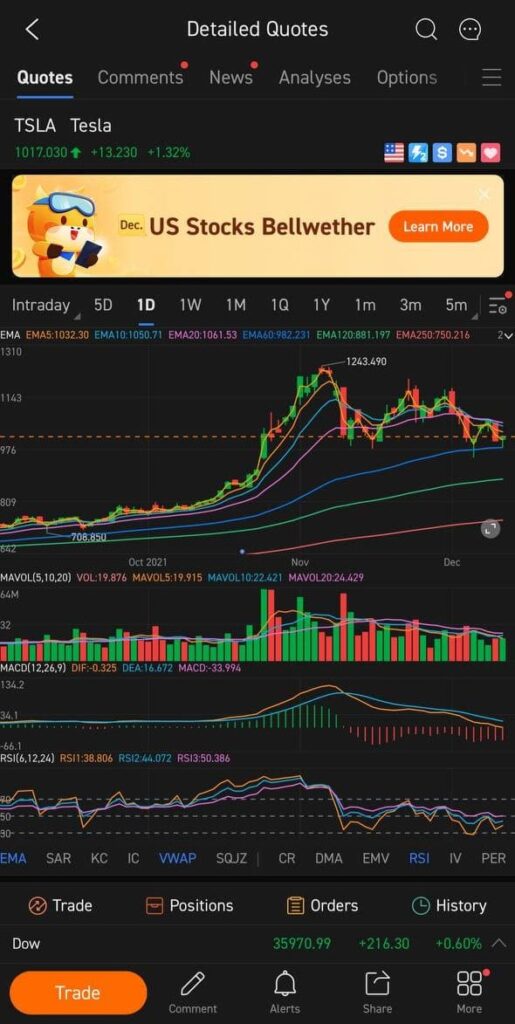
Other than the competitive fees and fast execution speeds (0.037 seconds), the moomoo app also has a technical charting feature that is very robust. With over 89 types of drawing tools and indicators to choose from, you can easily chart any stock using the in-built feature. On top of that, investors can also access 8 major types of line drawing tools, 37 types of line drawing, to meet the professional line drawing needs of various investors. The line drawing also includes line segments, polygons, wavy lines, Gann as well as Fibonacci tools.
Final Thoughts
The moomoo app has always been advertised as a one-stop shop for beginner investors but this has now changed as they start offering more robust features to cater to experienced investors as well. With the in-depth features readily available for all, this allows investors to make more informed decisions with their investments. Not to mention, with the technical charting being so robust and readily available in the app, you will not need to use another platform just to do your charting as well.