As an investor, we should always do our research before investing in any stock but this process could be very tedious, finding the relevant information we need for our analysis. Luckily for you, you don’t have to do any more tedious work because there is TIKR. With TIKR, you can do all your fundamental analysis and keep track of stocks that are on your watchlist, all in 1 platform. Without further ado, let me introduce to you TIKR.
Introduction
The TIKR team realized that there was a large gap between institutional investment research platforms like CapitalIQ, FactSet, Bloomberg, and retail investment research platforms like Yahoo/Google Finance. So, it became their mission to build a high-quality product to fill that large gap in the market.
TIKR has been in its building stages for almost 2 years now and has finally decided to soft launch their site in beta a few months ago. TIKR is currently powered by S&P CapitalIQ on 50k+ global stocks including financials, estimates, valuation, transcripts, filings, ownership, news, etc. They also have full coverage on REITs globally as well.
The platform has 15 years of financial data readily available for all forms of analysis and you can easily switch to quarterly data as well. TIKR also provides industry metrics like NAV, FFO, AFFO data.
If you want to try TIKR out, you can follow this link to get an invite to sign up.
Features
Let’s take a deep dive into the platform and see what features they have at the moment as well as what future features they have planned in store for users. For the following features, I’ll be using Square as an example.
Financial Results
Starting with the section on the financial results, we can easily analyze a company’s past financial results from the platform. From the images below, you can see that you get a full overview of the results starting from the revenue, expenses, and all the other one-off items. In the bottom section, you can also find supplementary data such as weighted average basic/diluted shares outstanding, basic EPS, EBITDA, and the individual expense items such as R&D and S&M.


On top of all that, you can visualize the data out just by clicking the items you want to visualize. Once you’ve clicked on them, a beautiful chart will appear, allowing you to visualize the data easily with 1 look. You can also change the values to be visualized in columns or in lines.
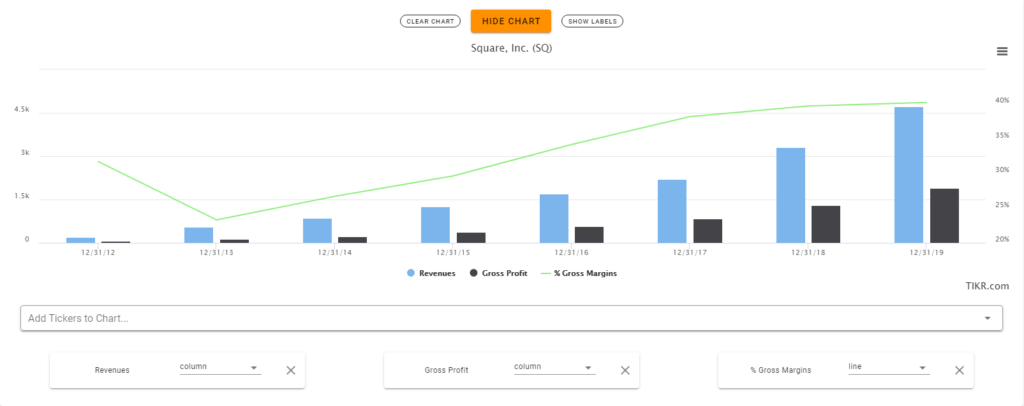
Overall, I am very impressed with the section on the financial results. The entire section is well updated with a full overview of all the data and information I need when making my analysis. You can even visualize some of the items to get a much faster insight into the company’s progression over time. It is also great that they have 15 years’ worth of data, allowing you to make very meaningful analyses on companies that have been around for quite some time now.
Analyst Targets
Moving onto the Analyst Targets section, this is one you should definitely check out. The TIKR platform aggregates all the analyst price targets and recommendations into 1 and shows you the full overview. As you can see below, you can see the number of buy/outperform/hold recommendations as well as the mean/median/high/low of the analyst price targets.
They also included the price close so that you can see how the stock price performed in comparison with the analyst estimates. At the bottom, you can see the % difference between the target price and the actual stock price.

Valuation Metrics
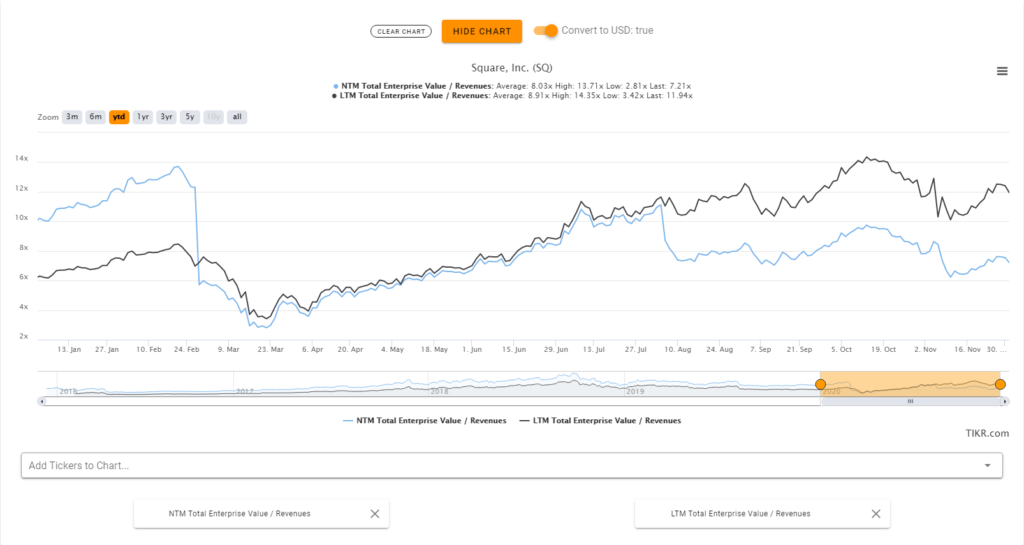
Moving onto the Valuation Metrics section, we can find all the most commonly used metrics in 1 page ranging from forward to trailing multiples and metrics. It is also good that they show these metrics quarterly so that you can see any changes that happen as time passes. This is definitely one of my most visited sections as it helps me save a ton of hassle trying to calculate all these figures out one by one which could take hours.

You can also chart out the valuation metrics to easily visualize the change in valuation as time passes. This definitely showcases how powerful the platform is as you can easily compare current multiples to historical averages.
Competitors
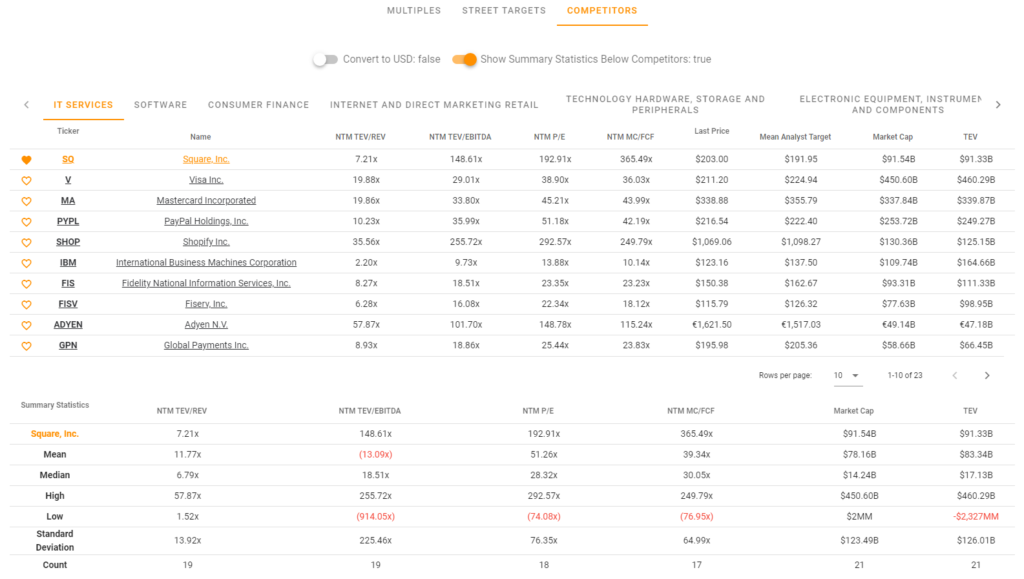
They also have a Competitors section which shows you a list of competitors to the company based on which industry it is in. For Square, because it is a FinTech company, it stands in both the finance and tech industry. As such, you can compare it with other competitors that you think it is up against such as Visa, Paypal, etc. It is also nice that they added in a mean and medium section below so that you can see where the company stands amongst its peers.
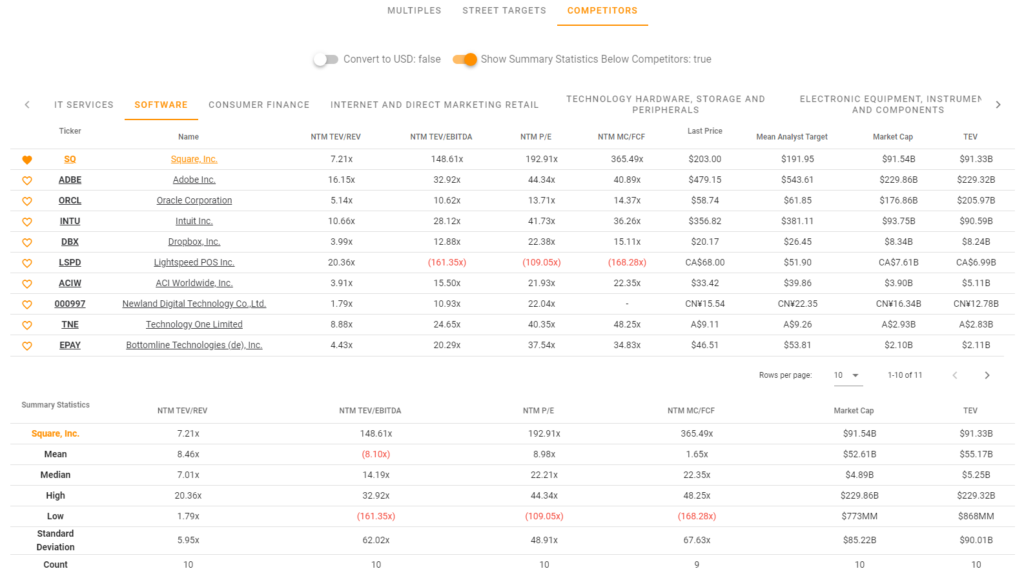
The image below puts Square in comparison with SaaS companies such as Adobe and Dropbox. The great thing about the platform is that it gives you the flexibility to compare the company with peers from different industries if it is in more than 1 industry like Square.
News Updates
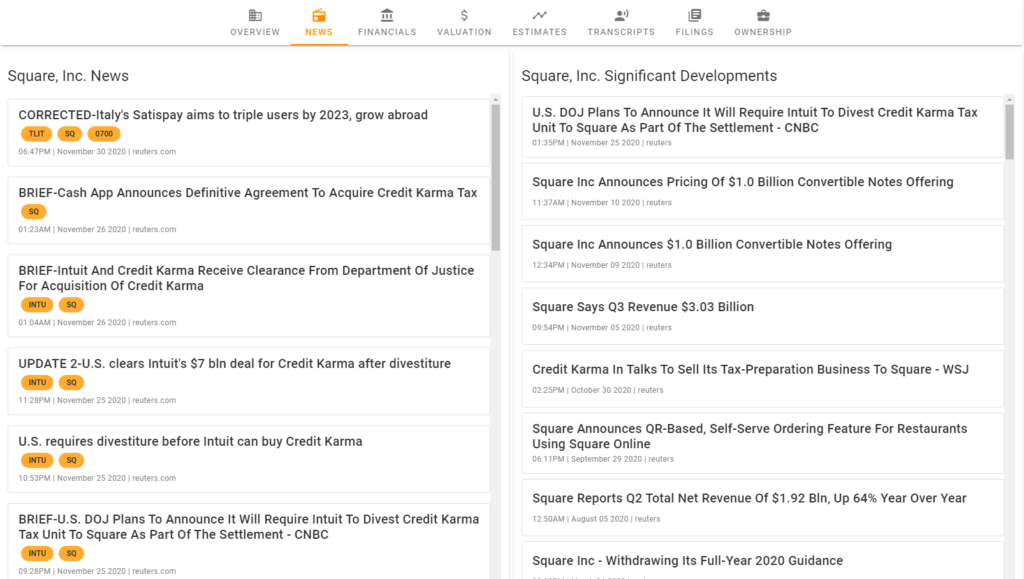
The News Updates section is pretty standard but very insightful as it aggregates not only news articles on the company but also significant developments and corporate announcements such as announcing of results and such. This section is pretty frequently updated so the news there is almost always up to date.
Watchlist
Last but not least, the 1 key feature that every stock market research tool needs, a Watchlist. The watchlist is pretty straight forward but they do have a few interesting features to their watchlist. As you can see from the bottom, you can add multiple columns in your watchlists such as % change, NTM (Next Twelve Months) TEV/REV, or NTM P/E. You can also find the mean analyst price target.
They also added at the bottom, the mean and medium across your watchlist. This can come in handy when you set your watchlist with all the stocks you have in your portfolio. This way, you can keep track of your overall portfolio with these metrics.

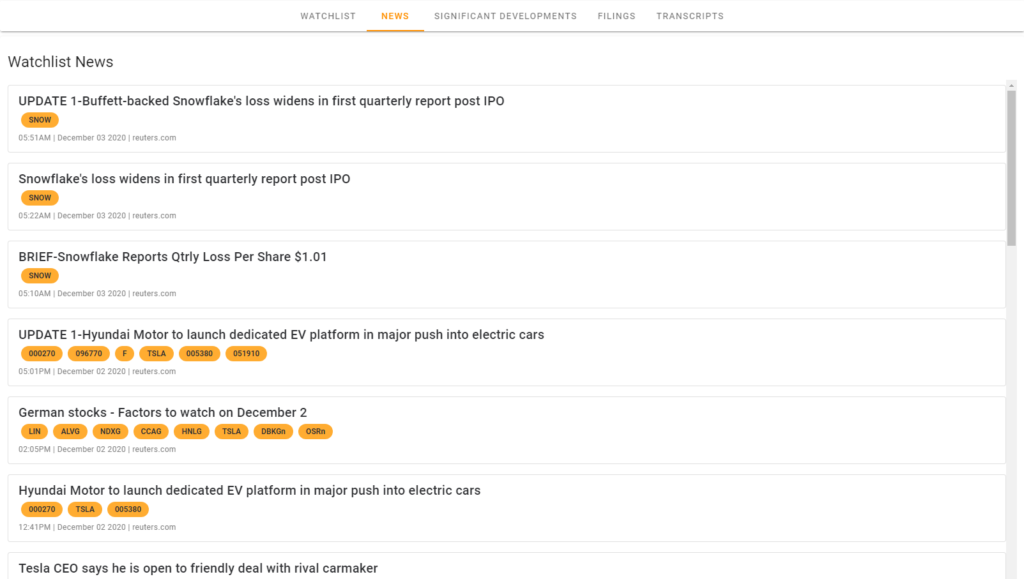
The TIKR team has recently added a new feature with the watchlist, which is the aggregated newsfeed. The newsfeed aggregates all the news, transcripts, and filings for the stocks in your watchlist, all in 1 place.
Future Features
As TIKR is still in its beta phase, there are still tons of new features that have yet to be implemented and I will be sharing 2 that they are currently working on right now.
Stock Screener
Every stock market research tool needs a stock screener as it is the easiest way for you to screen through the thousands of companies in the stock market. The feature is definitely confirmed and will be coming to us in the near future.
This is what the team had to say about this upcoming feature, “The stock screener will allow users to filter through the global universe of 50k+ stocks across pretty much any financial metric”.
Personally, I am hoping for something similar to what StocksCafe has but more in-depth. If possible, I would like to be able to screen for high growth tech companies using modern-day valuation metrics such as the rule of 40, ARR, NRR, and churn rate. From what I know, no other platform offers such a screener so it will be pretty interesting to see that appearing on TIKR.
Stock Valuation Tool
Stock valuation tools are highly sought after by investors as everyone wants to put a price tag on every single stock they own. These valuation tools are used to give investors certainty and a stronger conviction when buying or selling a stock. Investors tend to use these tools to set a benchmark on what they think the stock should be valued at.
This is what the team had to say about the stock valuation tool, “The automated stock valuation tool will allow users to quickly calculate the intrinsic value of stocks with easy-to-use templates”. I’m pretty interested to see what TIKR has in store for us as there are already many different stock valuation tools online using various methods such as DCF. It would be pretty interesting to see them such modern-day valuation metrics such as the rule of 40, ARR, NRR, or even churn rate to evaluate companies.
Final Thoughts
Overall, I’ve been using TIKR for months now and it’s been perfect. The entire platform is very easy to use and very informative, allowing you to do your fundamental analysis without much effort. I strongly recommend investors to start using this platform because it’s currently free.
If you want to try TIKR out, you can follow this link to get an invite to sign up. The platform is still very new and the team is very active in improving it with new features. I am definitely going to use TIKR for all my future analyses as well.