Capitaland Mall Trust (SGX: C38U) and Capitaland Commercial Trust (SGX: C61U) had a merger in 2020 and has now formed a combined entity, now named Capitaland Integrated Commercial Trust (SGX: C38U). This will be the first set of results released by the combined entity since its merger. Hence, investors are very excited to see how it has performed now that both REITs are combined into 1. Let’s take a quick look at the 5 key takeaways from the FY2020 results of Capitaland Integrated Commercial Trust.
1. Expected Drop In Gross Revenue and NPI
| Year on Year Difference | FY2020 | FY2019 |
|---|---|---|
| Gross Revenue | S$745.2 million (-5.3%) | S$786.7 million |
| Net Property Income (NPI) | S$512.7 million (-8.1%) | S$558.2 million |
Capitaland Integrated Commercial Trust (CICT) had a pretty rough year with the pandemic wiping out the retail portfolio’s performance as rental reliefs were given out to tenants. Overall, they still did pretty well as the Gross Revenue dropped by only 5.3% year on year and the NPI dropped by 8.1% year on year. The drop is mainly due to the rental waivers given out during the year.

It is also good to note that if we take a look into its individual asset class’s portfolio performance, we can see that the Integrated Development portfolio performed better year on year.
2. Drop In Distributable Income and DPU
| Year on Year Difference | FY2020 | FY2019 |
|---|---|---|
| Distributable Income | S$369.4 million (-16.4%) | S$441.6 million |
| Distribution Per Unit (DPU) | 8.69 cents (-27.4%) | 11.97 cents |
As expected, the Distributable Income and DPU dropped year on year by 16.4% and 27.4% respectively. However, investors shouldn’t be misled by this drop, thinking that CICT is in a bad shape and start panic selling. CICT, just like all the other retail REITs, had to provide rental relief/rebates for tenants during the 2nd quarter of 2020. If we were to exclude that, CICT’s performance would be pretty great with the inclusion of CCT’s portfolio.
As a long term investor, I am pretty excited to see what CICT has to offer moving forward into FY2021 as the economy recovers. The overall portfolio performance will definitely improve as Singapore moves into what I call, a post-pandemic state, whereby the economy starts to recover slowly back to pre-pandemic levels.
3. Healthy Financials
| As at 30 Dec 2020 | As at 30 Sep 2020 | |
|---|---|---|
| Aggregate Leverage | 40.6% | 34.4% |
| Interest Coverage | 3.8x | 4.0x |
| Average Cost of Debt | 2.8% | 3.1% |
Jumping into CICT’s financials, we can see that their leverage increased heavily to 40.6% now as compared to 34.4% the quarter prior. This huge jump is something that I am not very comfortable with as this limits the growth potential CICT has. Personally, I would prefer if the gearing is under 38% but of course, as CICT is relatively large in size, they can still make pretty meaningful acquisitions even though the gearing > 40%.
Other than that, it’s good to see that they managed to lower their cost of debt to 2.8% because, for every 0.1% increase in the interest rate, shareholders lose 0.02 cents per unit. The interest coverage ratio is still good at 3.8x, though it suffered a slight drop from 4.0x the quarter prior.
4. Portfolio Overview
Now that Capitaland Mall Trust and Capitaland Commercial Trust have merged into a combined entity, now known as Capitaland Integrated Commercial Trust, the overall portfolio is very diversified across 3 different property asset classes.
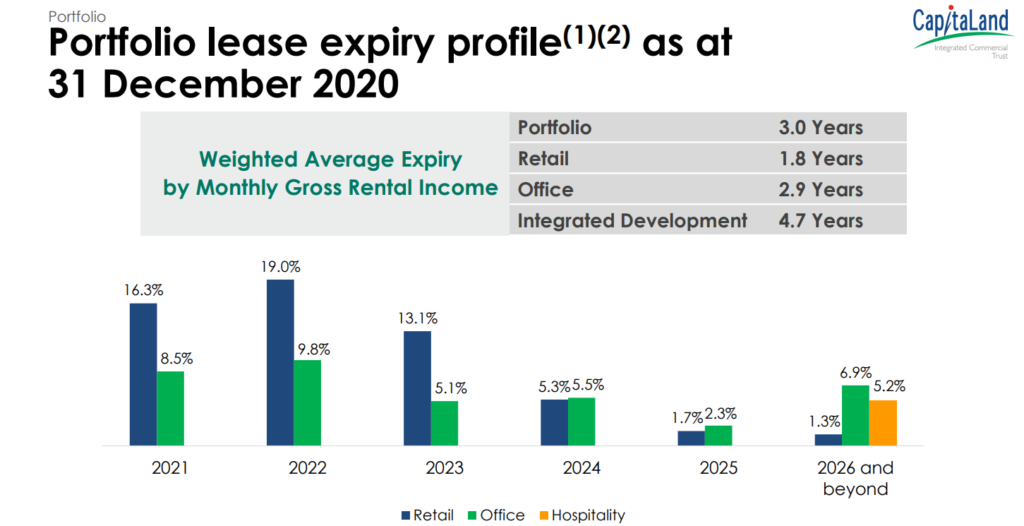
Taking a quick dive into their portfolio, we can see the WALE stands at a solid 3 years across the overall portfolio. Let’s take a deeper dive into each asset class and look at its performance for the year.
Retail Portfolio
Starting off with the retail portfolio, the occupancy rate is surprisingly high at 98% given the situation we are in and this goes to show how strong the management is, being able to maintain such high levels of occupancy even in such tough times. The rental reversion definitely went down but we can expect that to be reverted as we move into FY2021 and FY2022. The retention rate is also pretty strong at 84.5%.

It’s also good to see that shopper traffic has recovered to 67.9% of the level a year ago and the tenants’ sales per square foot have recovered to a resounding 94.5% of the level a year ago. This shows that retail footfall and the overall economy is already recovering near to pre-covid levels.
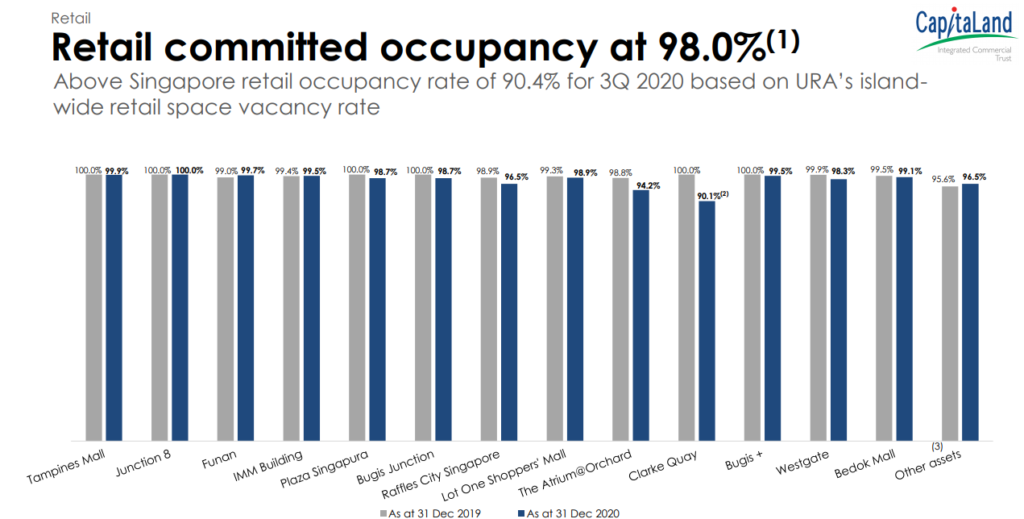
The overall portfolio maintained strong with the only noticeable losers being Raffles City Singapore, The Atrium@Orchard, and Clarke Quay. We can see that these 3 assets are around the central area of Singapore, which suffered the most during the pandemic as there were no tourists or shoppers going to that area during the 2Q and 3Q of 2020.
Office Portfolio
Moving onto the new asset class that is introduced into the REIT, their Office portfolio which came from Capitaland Commercial Trust.
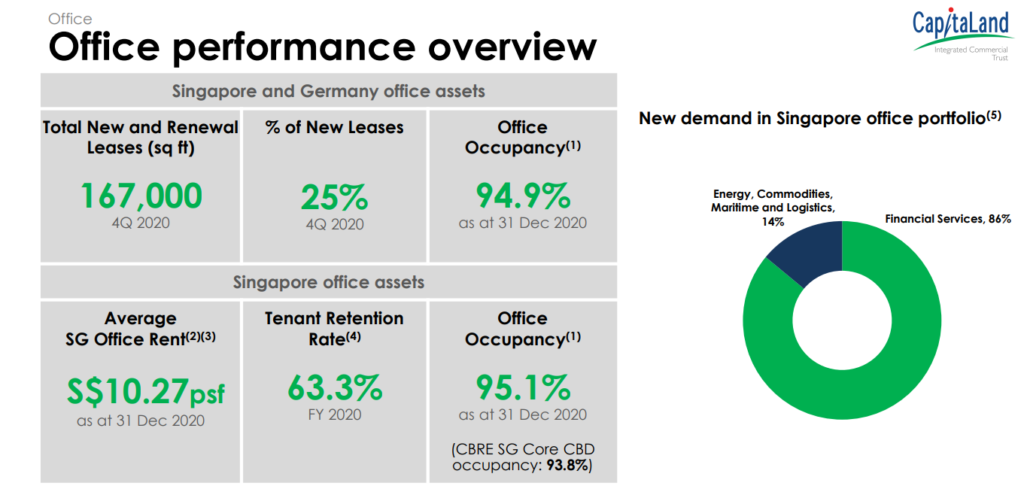
The portfolio has been doing very well during this tough time with the total portfolio occupancy rate standing at 94.9%. Its Singapore assets have a combined occupancy rate of 95.1%, way higher than the CBRE SG Core CBD occupancy of 93.8%.
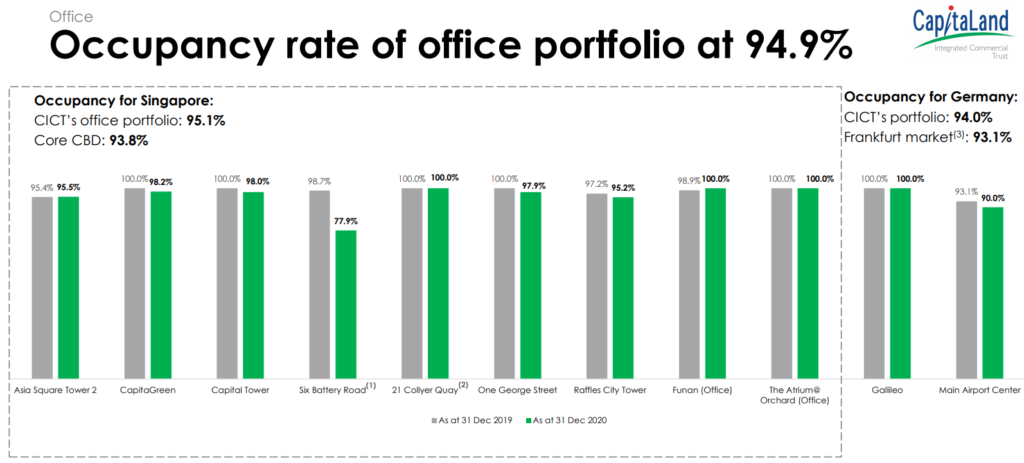
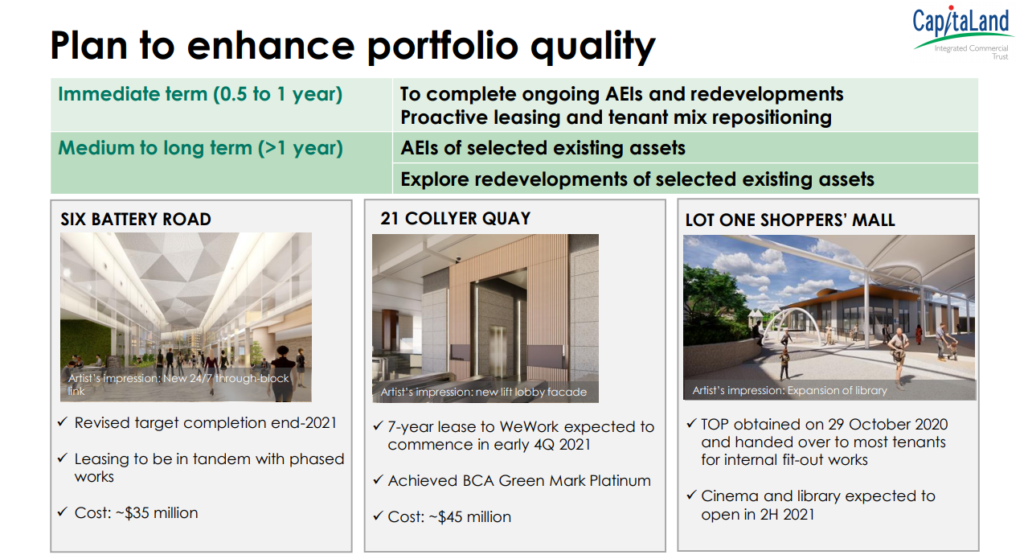
The overall portfolio maintained strong as well with the only noticeable losers being 6 Battery Road. The reason why the occupancy dropped so much is due to a partial upgrading which is to be completed in phases. As such, the occupancy will be expected to remain around this level until the upgrading is complete.
Also, 21 Collyer Quay is currently undergoing upgrading but WeWork has leased the entire NLA and the 7-year term is expected to commence in early 4Q FY2021 on a gross rent basis. Other than that, their Germany portfolio is also doing better than the Frankfurt market, standing at a solid 94% occupancy rate.
Integrated Developments Portfolio
Last but not least, the integrated developments portfolio, which also outperformed itself as compared to the year prior. The portfolio currently has 4 key assets and has a total occupancy rate of 97.8%.
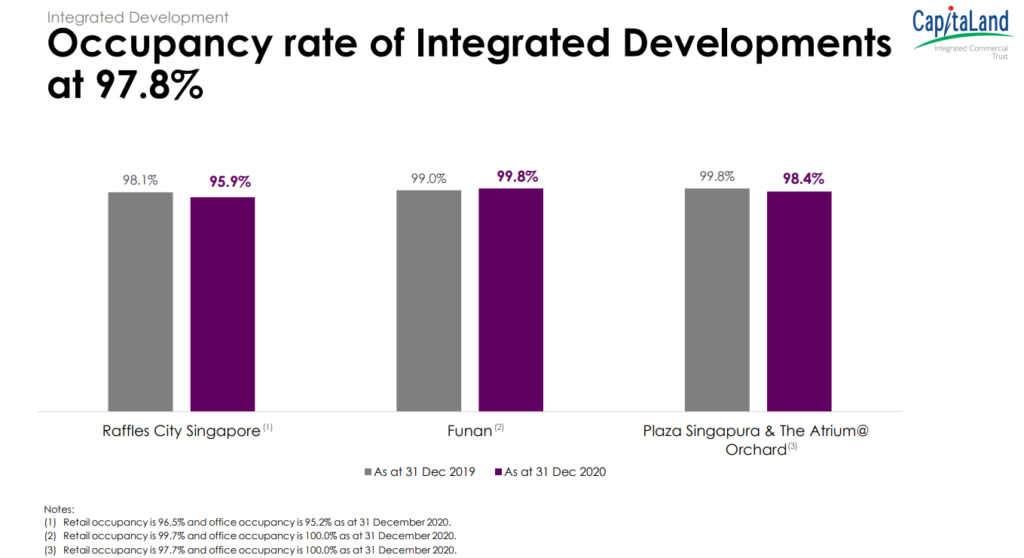
It is good to note that there will be a 5th asset being added in, CapitaSpring, which is on track to be completed in 2H FY2021. To date, about 38% of CapitaSpring’s 647,000 square feet (sq ft) of net lettable area (NLA) have been committed. Including leases in advanced negotiations, the development is on track to achieve more than 60% commitments by completion. If there are no delays or setbacks, we can expect to see CapitaSpring meaningfully contribute to CICT’s portfolio starting FY2022.
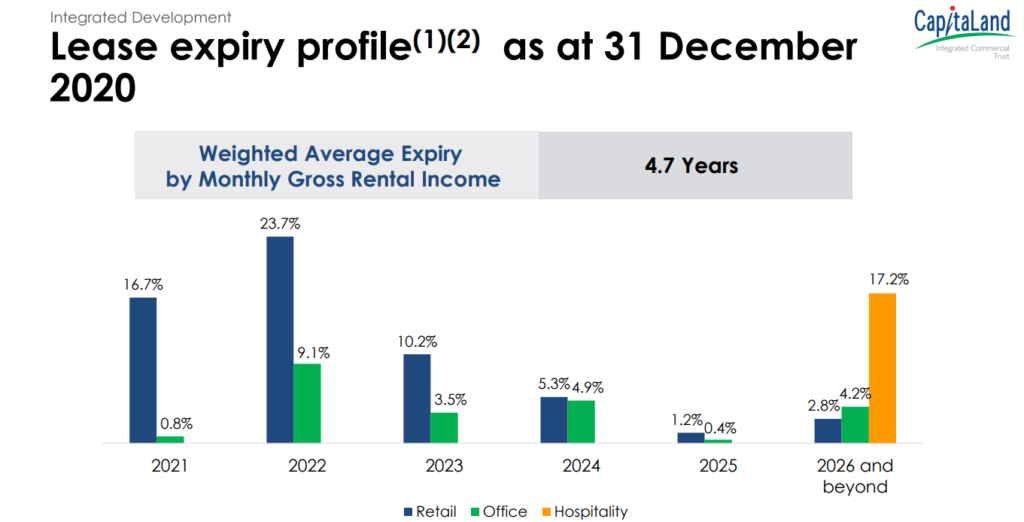
The overall WALE is fantastic on the integrated developments portfolio, standing at a solid 4.7 years. Not to mention the fact that there are no hospitality leases expiring until 2026 and beyond.
5. Growth Potential
Other than the completion of CapitaSpring, CICT’s management has also put in place several AEIs to help further enhance its portfolio which is all targeted to be completed by FY2021.
I believe that with its gearing levels standing around 40%, an acquisition funded with a mix of equity and debt is definitely a viable option for CICT if they find suitable opportunities. For long-term investors like myself, an Equity Fund Raising (EFR) would be great because it allows investors to accumulate more at a cheaper price.
Final Thoughts
Looking back at the FY2020 results of Capitaland Integrated Commercial Trust, I am pretty happy with the results and expected far worse because of how bad the pandemic affected the economy. Many people became jobless, shops and restaurants were forced to shut down and no one went out to shop other than for daily necessities. The strong recovery in 4Q FY2020 shows how strong the bounce back will be when the economy eventually moves out of the pandemic and into the post-recovery stage. I’ve since added onto my positions in CICT and will continue to ride on the recovery as I believe there is more upside to come as we move into FY2021.