Singaporeans love their local banks as well as their stock but which ones are the better performing ones? There are many ways to evaluate these banks and I will be going through these methods to help you better decide which bank you should invest in.
Disclaimer : This article was written in advance, so the prices don’t reflect today’s closing price !
Key Financial Ratios For Banks
The first thing to look at when investing in banks is their financial stability and whether or not they are doing well. So let’s take a look at the key financial ratios across our 3 banks.
| Bank | Net Interest Margin | Cost/Income Ratio | Non-Performing Loans Ratio | Liquidity coverage Ratios (LCR) | Leverage Ratio |
| DBS | 1.89% | 43% | 1.5% | 139% | 7% |
| UOB | 1.78% | 44.6% | 1.5% | All-currency – 146% Singapore Dollar – 306% | 7.7% |
| OCBC | 1.77% | 42.7% | 1.5% | All-currency – 155% Singapore Dollar – 273% | 7.7% |
Looking at the key financial ratios across the 3 banks, we can see that DBS is doing the best followed by a close fight between UOB and OCBC. DBS had a far higher NIM as compared to the other 2 banks and had a relatively low Cost/Income ratio of 43%. The Cost/Income ratio is used to see how well the company is managing its costs and spending to generate revenue. In essence, a low Cost/Income ratio signifies that the company is managing its costs well and is not overspending to generate revenue.
Winner : DBS
Diversification
Development Bank of Singapore (SGX:D05)

As we can see, more than half of DBS’s loan is made up of corporate loans. The consumer section is mainly comprised of housing loans (20% of total loans) and unsecured credit loans (2.9% of total loans). In the SME section, 90% of which are made up of loans to Singapore and Hong Kong SMEs. 10% of the SME section comprises of companies in highly impacted industries such as hotels, food and beverage, and retailers.
DBS has identified 8 key industries that will be impacted by the slowdown of the economy due to the COVID-19 outbreak. The 8 key industries are Oil and gas, Aviation, Hotels, Gaming/cruise ships, Tourism, Retail, Food and beverage and Shipping. It is good to note that the bank has already identified about 20% of these companies for close monitoring.

In the corporate loans section, 10.4% of which are made up of loans to companies in the Oil and Gas sector.

I believe the loans to the Oil and Gas sector is manageable and will not cause any sudden set backs as some of theses loans are already recognized as Non-Performing Assets (NPA).
United Overseas Bank (SGX:U11)
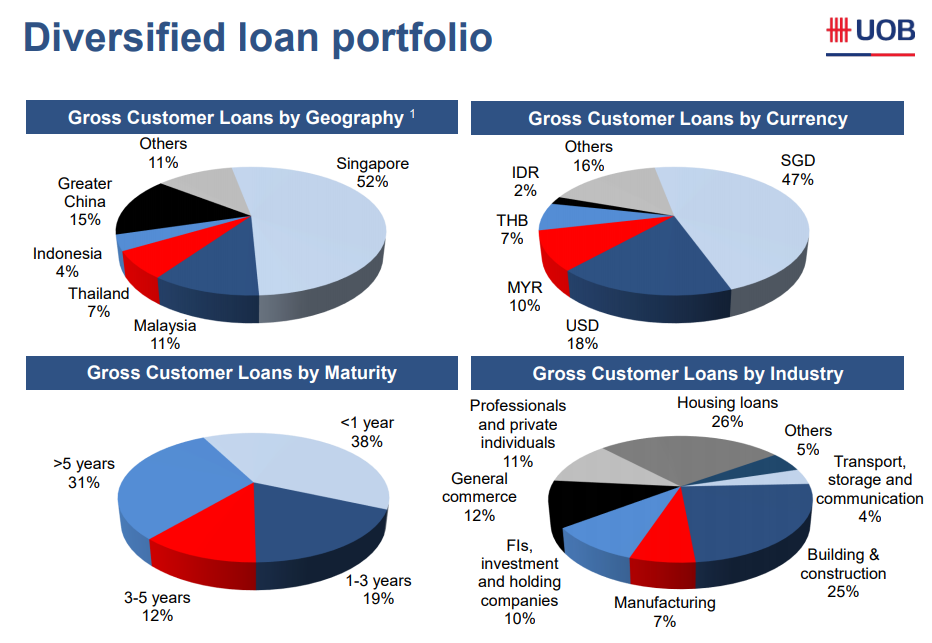
As we can see, UOB has a very diversified loan portfolio. Geographically, about 52% of its loans are to Singapore clients and the rest are spread out evenly across other countries. To summarize, sorted out based on industry, the loans are well spread out, with the highest weightage going into the Housing loans followed closely by the Building & Construction industry, making up 26% and 25% of the total loans respectively.
Oversea-Chinese Banking Corp. (SGX:O39)

Looking at the customer loans, we can see that OCBC also has a very diversified loan portfolio. We can see that the industry with the highest weightage is the Building & Construction industry, closely followed by Housing Loans, making up 25% and 23% of the total loans respectively.
It is also good to note that the loans made to customers in the Oil and Gas industry only comprise 5% of the total loans.
Great Eastern
For those who didn’t know, OCBC has many subsidiaries under its wing but the most popular one is actually Great Eastern, the insurance company. You can also see a full list of OCBC’s subsidiaries below.

It is a double edged sword for OCBC to have so many subsidiaries as it can help boost their results and performance or pull them down instead.
With Great Eastern’s recent quarter results, we can see that the company actually had a 90% decrease year-on-year in net earnings. This in turn will affect OCBC’s earnings as well.
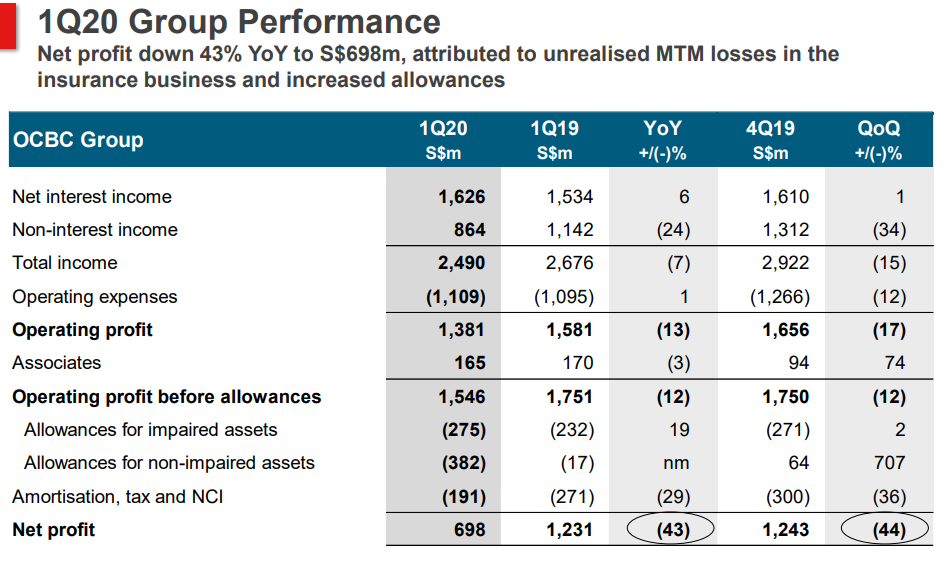
As we can see, OCBC’s 1Q20 results were badly affected due to Great Eastern’s bad results. Of course the results were badly impacted due to the market’s extreme volatility over the past few months.

As we can see, Great Eastern actually had a 101% increase in Operating profits year-on-year but had huge non-operating losses due to unrealized MTM losses attributed to unfavorable investment markets.
Mark-to-market (MTM) losses are losses generated through an accounting entry rather than the actual sale of a security. Mark-to-market losses can occur when financial instruments held are valued at the current market value.
So in reality, Great Eastern’s losses were actually just due to the huge market crash and not due to something that they could have controlled.
Valuation Against 5 Year Average
It is important to take a look at banks and their current valuation against its 5 year average as we can safely assume that in most cases, the market will always revert back to the “mean” or the average. Therefore, I’ve constructed a table to find out the 5 year average and compare it to the current valuation to see if the banks are considered “undervalued” at their current valuations.
| Bank | Price / Earnings 5 Year Avg v. Current | Price / Book 5 Year Avg v. Current | Dividend Yield 5 Year Avg v. Current |
| DBS @ $23.06 | 11.08 v. 6.28 | 1.22 v. 1.2 | 5.43% v. 5.46% |
| UOB @ $23.10 | 10.78 v. 9.12 | 1.12 v. 0.954 | 5.06% v. 5.63% |
| OCBC @ $9.73 | 10.55 v. 6.64 | 1.17 v. 0.935 | 4.45% v. 5.45% |
As we can see, OCBC’s current valuation is the most attractive as compared to UOB and DBS. DBS’s current valuations are closest to its 5 year averages, followed by UOB. If we assume that the banks’ valuation will revert back to the average, we can safely assume that OCBC has the highest upside to go, followed by UOB and then DBS.
Winner : OCBC
5 Year Growth
It is also good to take a look at these banks and their growth for the past 5 years and whether or not there is a high probability that the bank will perform similarly for the next 5 years to come. For the table below, I’m using the bank’s growth from 2014 to 2019.
| Bank | Market Cap | EPS | Dividends | Return on Equity |
| DBS | +5.97% / year +29.86% | +10.33% / year +51.64% | +22.41% / year +112.07% | +3.51% / year +17.54% |
| UOB | +2.44% / year +12.21% | +5.79% / year +28.96% | +14.67% / year +73.33% | -1.18% / year -5.88% |
| OCBC | +3.17% / year +15.83% | +1.50% / year +7.51% | +9.44% / year +47.22% | -3.50% / year -17.52% |
As you can see from the table, DBS has the best growth amongst the 3 banks, followed by UOB and then OCBC. It is also good to note that UOB has never held a rights issue so far. DBS had a rights issue in January of 2009 to help boost its liquidity and financial strength. OCBC has had 2 rights issues, one in 2005 and another in 2014, and 1 stock split in 2005. From the amount of rights being issued, it is not a surprise that OCBC has had its ROE deteriorated.
Winner : DBS
Final Thoughts
Personally, I favor DBS and OCBC over UOB for separate reasons. DBS because of its phenomenal growth for the past 5 years and OCBC because of its diversified business with subsidiaries in many different industries like insurance and wealth management. I also like the fact that OCBC has been consistently growing its dividends year on year and that they offer SCRIP dividends for investors who want to reinvest their dividends to further compound their gains.
It is sad to see OCBC lagging behind its peers due to the acquisitions they have made in the past like acquiring Bank of Ningbo as well as the rights issues that were held that further diluted shareholders’ equity.