With the overall market now starting to seem more and more overpriced, value investors have a hard time trying to find stocks to invest in. With the help of the moomoo app and its stock screener tool, I’ve managed to find some stocks that fit the parameters I set. Without further delay, let’s dive right into how I did it.
Disclaimer: The information written in this article is based on my own research and opinions.
Note: This is a sponsored post
Stock Screener
First off, I will talk about the screener I used on the moomoo app to help me find stocks in the Singapore market.

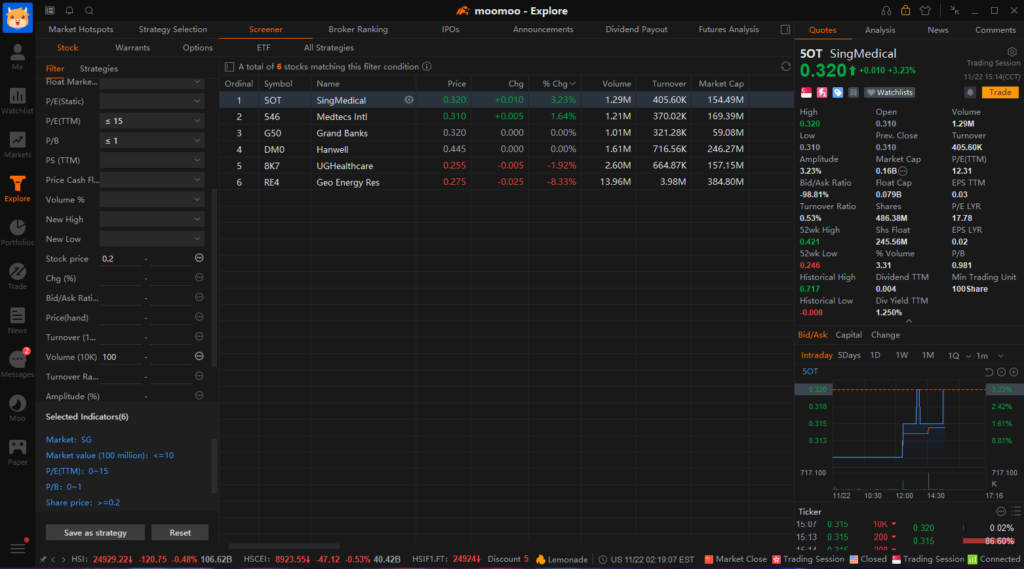
As you can see from the above screenshot, here are the parameters I used to find stocks to invest in through the moomoo app’s stock screener tool.
- Market: SG
- Market Cap: <= $1billion
- TTM PE Ratio: <= 15
- PB Ratio: <= 1
- Share Price: >= $0.20
- Volume: >= 1 million
Let’s go through each criterion that is being used to screen for value stocks through the moomoo app’s stock screener. First off, we are looking for undervalued companies that are preferably smaller in size as they tend to be mispriced more. This is why we are screening for companies that have a market cap of under $1 billion.
We will then filter out companies with a TTM PE ratio of more than 15 and PB ratio of more than 1 because we want a stock that has a fairly valued PE ratio that is also worth less than its book value. I also added in a minimum share price of $0.20 because we want to avoid penny stocks that can be easily manipulated. Last but not least, a minimum volume of 1 million shares to ensure that the stock is traded fairly regularly so that we can buy and sell with little to no trouble. After screening through, we ended up with 6 stocks that match these criteria.
Further Analysis
Here, we will be using Medtecs as an example to showcase the moomoo app as well as its core features.

Starting off with the main stock page, we can see the stock’s overall price movement on a chart as well as several key financial ratios such as market cap, PE, PB, Dividend Yield as well as 52-week highs and lows.

As we dive deeper into their financial statements, we can see the company’s revenue numbers, gross profit, operating expenses as well as overall operating profit. It is good to note that the moomoo app also shows you the year-on-year increase or decrease which helps you streamline your analysis process with a quick glance rather than calculating the numbers yourself.

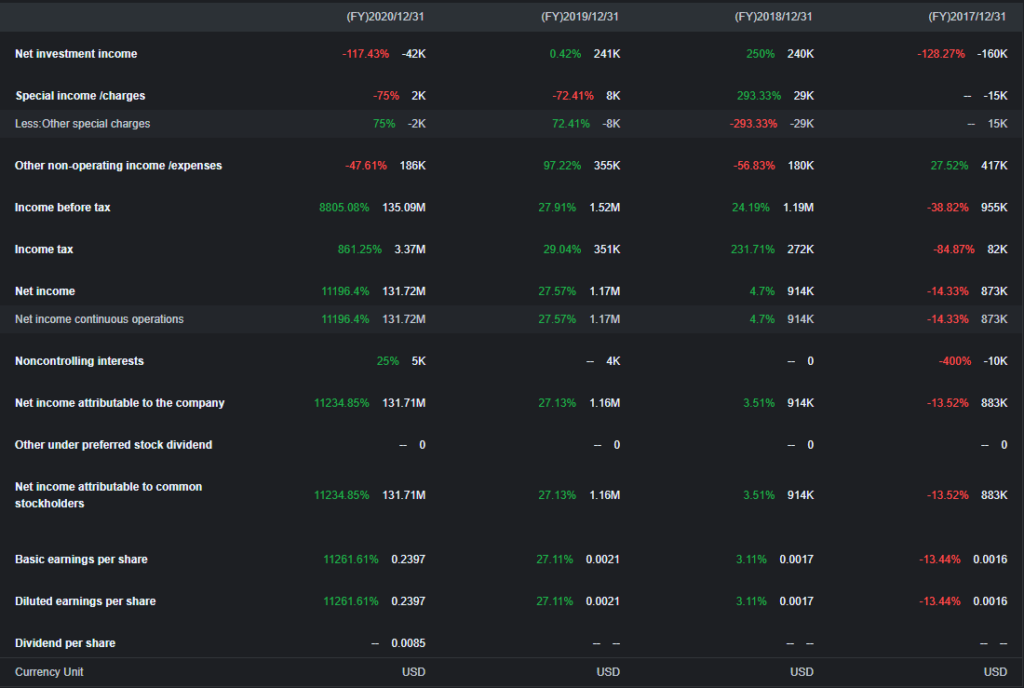
We can also see that the net income as well as other figures that investors might be interested in like net investment income, income tax paid as well as the earnings per share.

As we look into the key financial ratios, we can see important figures such as Return on Equity (ROE), Return on Assets (ROA), and Return on Invested Capital (ROIC). On top of that, you can also find other meaningful data such as Free Cash Flow (FCF) to Sales and Net Income. You can also easily find other figures such as Gross, Operating, EBIT, EBITDA as well as Net margin. Similar to the financial statements, the moomoo app includes the year-over-year increase/decrease so that you can easily identify if the company has improved over time.
Final Thoughts
As a value investor myself, I find moomoo trading app really useful as it helps me accelerate the entire process from screening stocks to doing fundamental analysis. All the information I need to make an informed decision is readily available through moomoo app.