Entering 2H FY2023, investors are starting to rejoice as inflation is coming down from its peak of 9.1% in June 2022 to just 4% in May 2023. Despite this piece of good news, the FEDs are still planning on hiking rates a few more times before the year closes. Generally, higher rates would benefit banks more since this helps them increase their Net Interest Margin (NIM) but if the economy slows down due to the high interest rate, that would result in lower borrowing and spending, which ultimately impacts the banks negatively. Our 3 local banks namely DBS (SGX: D05), UOB (SGX: U11), and OCBC (SGX: O39) have started to see their share price being negatively impacted from its peak in February. Does this mean that they are undervalued? In this article, I will cover the recent 1H FY2023 earnings of our 3 local banks as well as discuss if they are undervalued at their current valuation.
1H FY2023 Operating Performance
| Year on Year Difference | Revenue | Profit Before Allowances | Allowances Made | Net Profit |
|---|---|---|---|---|
| DBS | S$9.981 billion (+34%) | S$6.168 billion (+50%) | S$233 million (+131%) | S$5.26 billion (+45%) |
| UOB | S$7.065 billion (+40%) | S$4.177 billion (+48%) | S$534 million (+69%) | S$2.925 billion (+45%) |
| OCBC | S$6.805 billion (+30%) | S$4.742 billion (+45%) | S$362 million (+211%) | S$3.589 billion (+38%) |
Starting off with the operating performance of the 3 local banks, we can see that UOB has grown its revenue the most by 40%, with DBS trailing behind at 34% and OCBC at 30%. When we look at the profit before allowances, DBS takes the lead at 50%, with UOB and OCBC trailing behind at 48% and 45%.
Looking at the allowances made, we can see that all 3 local banks accounted for more allowances in 1H FY2023, with OCBC increasing the most year over year by 211%, with DBS and UOB trailing behind at 131% and 69% respectively. Taking aside the year-over-year growth, UOB actually has the most allowances made in terms of dollar value at S$534m, followed by OCBC at S$362m and DBS at S$233m. This could imply that DBS either has a more diversified debt portfolio or is more confident that there will be lesser bad debt to account for moving forward.
Lastly, we can see that all 3 local banks made huge net profits for 1H FY2023 with DBS and UOB growing their net profits by 45% year over year while OCBC trails behind at only 38%.
Key Financial Ratios
| As at 30 June 2023 | Net Interest Margin | Cost/Income Ratio | Non-Performing Loans Ratio | Liquidity Coverage Ratios (LCR) | Leverage Ratio | Common Equity Tier 1 |
|---|---|---|---|---|---|---|
| DBS | 2.14% | 38% | 1.1% | 179% | 6.5% | 14.1% |
| UOB | 2.13% | 40.9% | 1.6% | 160% | 7.0% | 13.6% |
| OCBC | 2.28% | 37.8% | 1.1% | 158% | 7.1% | 15.4% |
Moving onto key financial ratios, as I’ve mentioned before, is definitely the most important part when analyzing and evaluating a bank. At first glance, we can see that OCBC has the highest NIM at 2.28% while its peers are trailing behind with DBS at 2.14% and UOB at 2.13%.
Next, we will look at the Cost/Income ratio which OCBC is leading as well at 37.8% whereas DBS and UOB trail behind at 38% and 40.9%. Just to recap, the Cost/Income ratio is used to see how well the company is managing its costs and spending to generate revenue. In essence, a low Cost/Income ratio signifies that the company is managing its costs well and is not overspending to generate revenue.
The LCR and NPL ratio seems to be rather consistent across the DBS and OCBC with UOB posting slightly weaker numbers for its NPL. DBS holds the strongest LCR at 179% with UOB trailing behind at 160% and OCBC at 158%. In addition, OCBC has the highest leverage ratio at 7.1% and the strongest CET-1 ratio at 15.4%. DBS’s leverage ratio is the lowest amongst the 3 local banks at 6.5% with UOB trailing ahead at 7.0%. DBS edges UOB out with a CET-1 ratio of 14.1%, beating UOB’s 13.6%.
Based on the financial ratios, we can definitely see that OCBC has performed the best with the strongest balance sheet, highest NIM, and efficient cost/income ratio.
Valuation
| Annualized PE Ratio | PB Ratio | Dividend Yield | Return on Equity | |
|---|---|---|---|---|
| DBS @ $34.35 | $4.06 (8.46x) | $21.85 (1.57x) | 5.59% ($1.92) | 18.9% vs 13.3% yoy |
| UOB @ $28.87 | $3.42 (8.44x) | $25.11 (1.15x) | 5.54% ($1.6) | 14.1% vs 11.0% yoy |
| OCBC @ $13.02 | $1.58 (8.24x) | $11.33 (1.15x) | 6.14% ($0.8) | 14.3% vs 10.4% yoy |
Based on the last closing price of the 3 local banks, we can see that OCBC is the cheapest in terms of valuation as compared to its peers whereas DBS is the most expensive bank in terms of valuation. At the last closing price, DBS is valued at an 8.46x PE with a PB of 1.57x. UOB trails behind closely with a PE of 8.44x and a much lower PB ratio of 1.15x. OCBC comes last with a PE of 8.24x and a PB ratio of only 1.15x. When comparing the annualized forward dividend yield, OCBC has the highest yield at 6.14% with DBS coming in second with a yield of 5.59% and UOB following close behind in 3rd place at 5.54%.
It is important to note that when talking about yield, DBS’s management has guided a 24 cents annual increase in the baseline dividends moving forward. On top of this, they do have a surplus of S$3B based on a CET-1 operating range of 12.5% – 13.5% which could be distributed back to shareholders in the form of ordinary dividend step-up, one-off special dividends or even share buybacks. This could potentially make DBS a stronger investment than its peers.
Another good metric to valuate these banks would be using ROE or ROCE. Return on equity (ROE), also known as return on common equity (ROCE), is a measure of a business’s profitability. Specifically, it is a ratio describing the rate of profit growth a business generates for shareholders and owners. DBS has the strongest ROE at 18.9%, growing from 13.3% YoY. OCBC comes second at 14.3% as compared to a year ago at 10.4%. UOB comes last with an ROE of 14.1% as compared to a year ago at 11.0%.
Potential Growth Catalysts
With the 3 local banks reaching all-time highs again, are there any more potential growth catalysts for them to grow over the next 12 months?
Possible Interest Rate Hikes in FY2023
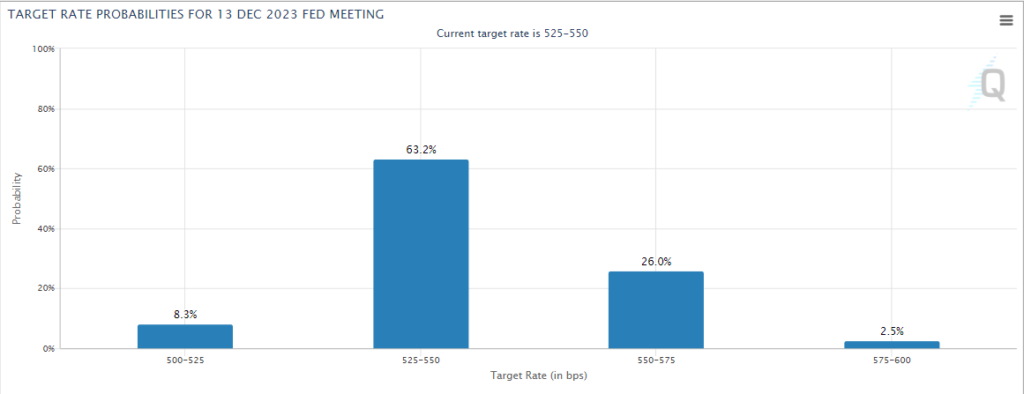
With the nonstop rate hikes in FY2022, the interest rates are now at highs above 5%. There are some analyst predictions and forecasts that there could be 1 more rate hike in FY2023 which could bring rates to 5.5% – 5.75%. The image above shows the forecasts for 13th December 2023, which is the last FED meeting for the year. There is a 63.2% chance that rates will remain at 5.25% – 5.5% towards the end of the year. We all understand that the increase in interest rate will impact the banks but in what way exactly?
When interest rates are higher, banks can make more money either by charging higher interest on loans or by taking advantage of the difference between the interest banks pay to customers and the interest the bank can earn by investing. At times, a bank might pay its customers a full percentage point less than it earns through investing in short-term interest rates. As such, we will need to understand what is the CASA ratio for a bank.
In short, the CASA ratio stands for the “current and savings account” ratio. The CASA ratio of a bank is the ratio of deposits in current and saving accounts to total deposits. A higher CASA ratio indicates a lower cost of funds because banks usually give a much lower interest rate on current and savings accounts. Indirectly, a higher CASA ratio will translate to a higher net interest margin as well for banks.
DBS has the highest CASA ratio at 56.2%, with UOB trailing behind at 47.6% and OCBC at 45.3%. In comparison to a year ago, the CASA ratios have come down substantially because rates were much lower a year ago, which allowed banks to capitalize more on lower rates. Now then rates have increased so much, banks need to stay competitive to maintain customer deposits. This means giving out higher interest through current and savings accounts to keep customers.
As we don’t know how sensitive the 3 local banks are to interest rates, and the management has not guided any base case numbers to follow unlike in FY2021, we can’t give an estimate on how much the banks will be impacted in terms of its net interest income should rates increase or decrease.
Final Thoughts
In summary, all 3 local banks performed remarkably in FY2023, being able to continuously grow their business amidst the pandemic situation. Based on the valuation metrics above, we can see that OCBC and UOB can be considered undervalued with a PB of only 1.15x and a low PE of only 8.24x and 8.44x. DBS on the other hand, is rather expensive when we look at its PB of 1.57x but we have to consider that the PE is also in line with its peers at 8.46x. Another reason why I find all 3 local banks undervalued is because they are yielding above 5% which is quite uncommon as they are usually yielding within the range of 4%.
Among the 3 local banks, we can see that OCBC has done the best with the strongest balance sheet, highest NIM as well as efficient cost/income ratio. Despite OCBC having the lowest growth in net profit YoY, we need to account for the fact that they made a lot of allowances (~S$362m), a 211% increase year over year as compared to its peers which only grew their allowances by 131% and 69% respectively. When we talk about valuation, OCBC is also the cheapest with a PE of only 8.24x, PB of only 1.15x, and a forward annualized yield of 6.14%, which is higher than our risk-free rate in Singapore (CPF SA – 4%).