After Lendlease REIT (SGX: JYEU) completed its acquisition of JEM in April 2022, investors had high expectations towards how well the REIT would perform after a full year’s worth of contribution from its new acquisition. With Lendlease REIT releasing its FY2023 results recently, this would be a great time to review its latest acquisition and see how well it has fared over the past year. In this article, we’ll dive deep into Lendlease REIT’s FY2023 results and see if it’s still a good buy at its current valuation.
1. Huge Growth In Gross Revenue and NPI
| Year on Year Difference | FY2023 | FY2022 | FY2021 |
|---|---|---|---|
| Gross Revenue | S$204.876 million (+101.5%) | S$101.662 million (+29.3%) | S$78.651 million |
| Net Property Income (NPI) | S$153.937 million (+103.9%) | S$75.508 million (+32.7%) | S$56.918 million |
Investors were definitely excited with Lendlease REIT’s FY2023 results given the huge growth in Gross Revenue and NPI after the full acquisition of JEM. Looking at the numbers, we can see that the Gross Revenue grew by 101.5% and the NPI grew by 103.9% thanks to the acquisition of JEM. Prior to this in FY2022, Lendlease REIT’s Gross Revenue only grew by 29.3% while its NPI grew by 32.7% year over year. Apart from the JEM acquisition, the overall performance improved due to the overall retail portfolio achieving a positive rental reversion of 4.8% and the office portfolio achieving a positive rental reversion of 5.9%.
Of course, to really see how well the management handles the REIT’s portfolio, we will need to wait and review the FY2024 results to see if they can continue to organically grow the REIT through positive rental reversions and Asset Enhancement Initiatives (AEIs).
2. Strong Growth In Distributable Income and DPU
| Year on Year Difference | FY2023 | FY2022 | FY2021 |
|---|---|---|---|
| Distributable Income | S$108.202 million (+51.3%) | S$71.505 million (+29.7%) | S$55.123 million |
| Distribution Per Unit (DPU) | 4.7 cents (-3.1%) | 4.85 cents (+3.6%) | 4.68 cents |
Following the strong growth in Gross Revenue and NPI, the Distributable Income also saw strong growth, increasing by 51.3% year over year. Despite this huge growth, the DPU actually saw a slight decrease of 3.1% year over year. This was primarily due to the higher cost of debt as interest rates continued to rise.
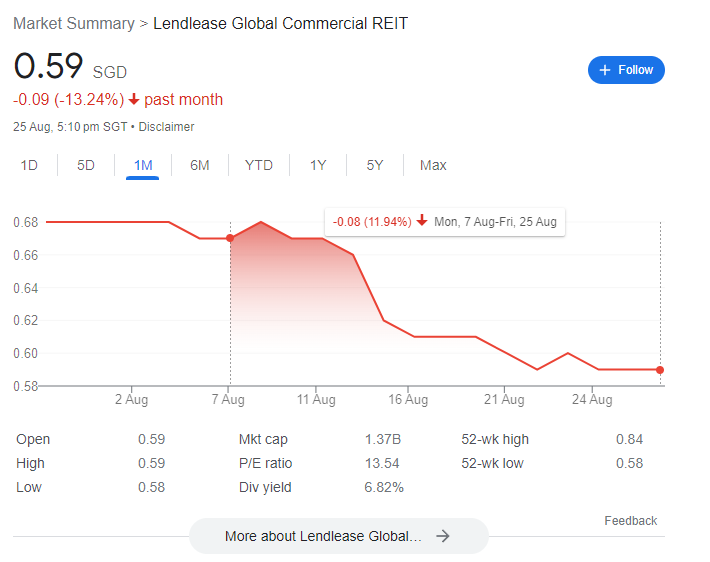
As we can see from the share price movement, investors were disappointed with the decrease in DPU despite the strong growth in Lendlease REIT’s performance, which resulted in a ~12% decrease since the earnings release.
3. Deteriorating Financials
| As at 30 June 2023 | As at 30 June 2022 | As at 30 June 2021 | |
|---|---|---|---|
| Aggregate Leverage | 40.6% | 40.0% | 32.0% |
| Interest Coverage Ratio | 4.2x | 9.2x | 8.9x |
| Average Cost of Debt | 2.69% | 1.69% | 0.88% |
To better understand why Lendlease REIT saw a net decrease in its DPU year over year, we will need to take a look at its financials which have deteriorated over the past few years. In FY2021, before the JEM acquisition, Lendlease REIT had a very strong balance sheet with a 32% aggregate leverage, a high interest coverage ratio of 8.9x, and a very low cost of debt at 0.88%. Moving onto FY2022, when interest rates soared to highs of 4% towards the end of the year, the aggregate leverage increased significantly to 40% after the JEM acquisition. The interest coverage ratio stood strong at 9.2x and the cost of debt increased by approximately 2x to 1.69%, which was still manageable.
As we close out FY2023, Lendlease REIT saw its aggregate leverage increase to 40.6%, with its interest coverage ratio falling drastically to only 4.2x. On top of this, the average cost of debt has risen significantly to 2.69%. Approximately 61% of Lendlease REIT’s debt is hedged to fixed rates, which makes them more vulnerable to rate hikes as compared to other REITs that have increased their percentage of debt in fixed rates. In comparison, another retail REIT, Frasers Centrepoint Trust, has pushed its percentage of fixed-rate debt by huge margins, increasing it from 63% to 76.4% in just 1 quarter.
Hopefully, FY2024 will be a better year for Lendlease REIT as they navigate the high interest rate environment. It would definitely be wise for them to lower their aggregate leverage in this current situation so that they can lower their overall cost of debt
4. Upsized Portfolio
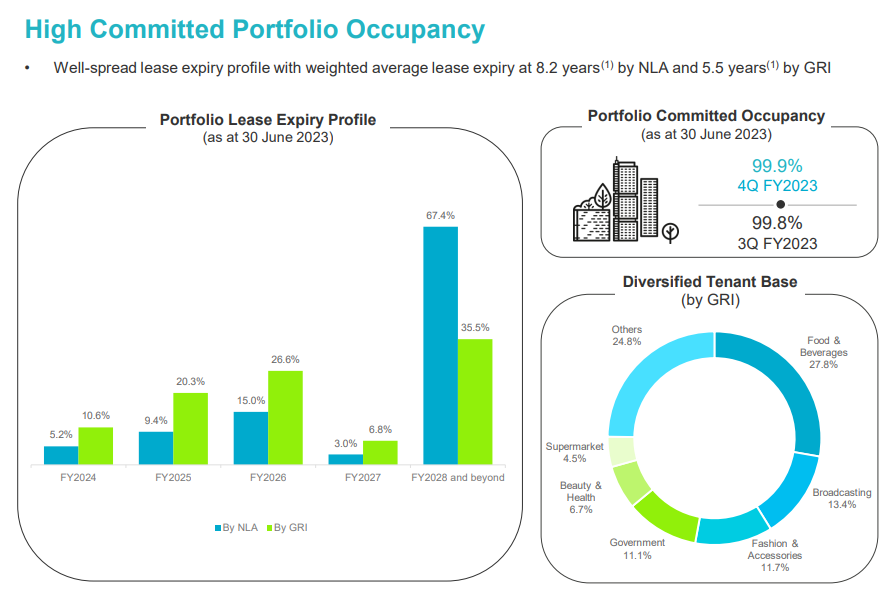
On a brighter note, it’s a good thing that Lendlease REIT’s portfolio has gained more stability after the JEM acquisition. The overall portfolio has a strong occupancy of 99.9% and now has a long WALE of 8.7 years by NLA and 5.5 years by GRI. On top of this, most of its leases expire in FY2028 and beyond. Its tenant base is also more diversified now as it has more assets in its portfolio.
5. Potential Growth Catalysts
Given the current outlook on Lendlease REIT, investors might not be too keen on investing since its aggregate leverage is so high, limiting its growth opportunities via possible acquisitions in the future. Despite this, could there be other potential growth catalysts for Lendlease REIT for investors to consider?
Increased Stake in Parkway Parade
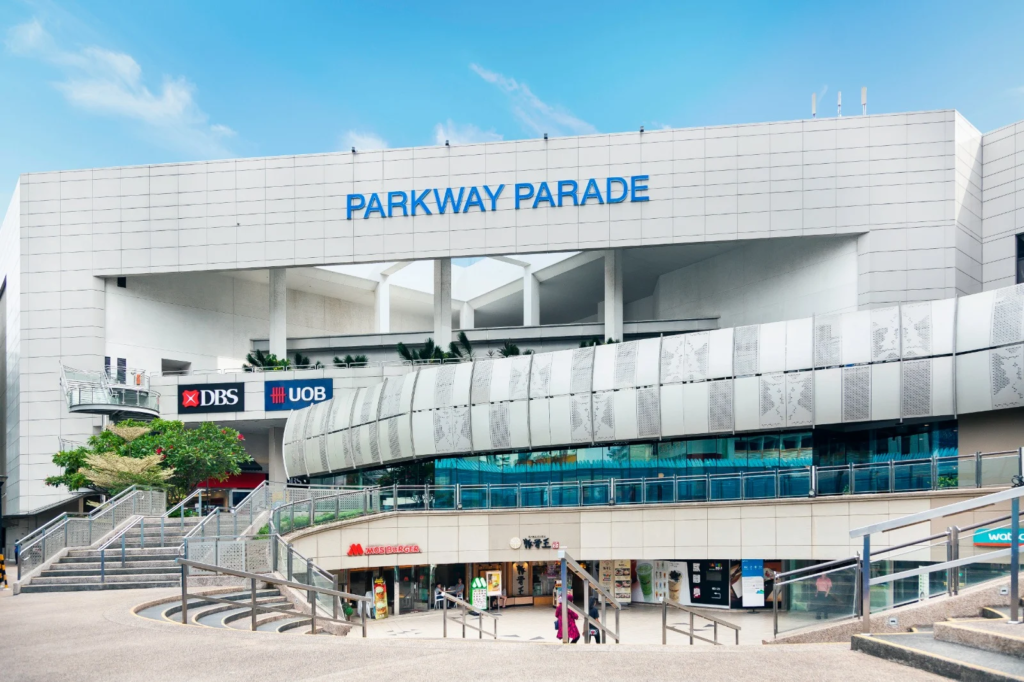
First off, we’d like to discuss Lendlease REIT’s current stake in Parkway Parade. As of Lendlease REIT’s FY2023 results, they have a 10% interest in Parkway Parade. Given the right circumstances, Lendlease REIT could consider increasing its stake in Parkway Parade, similar to what it did with JEM. They had an initial stake (53%) in the asset, which grew over time (+19.8% over 2 weeks) and when the management saw a suitable opportunity, they acquired the asset in full.
Planned Development on 313@Somerset
Another possible growth catalyst would be the development of a multifunctional event space adjacent to 313@Somerset. The combined NLA with 313@Somerset of approximately 330,000 sqft enlarges and strengthens the REIT’s retail presence in the area. The AEI is expected to take approximately 12 to 18 months to complete once the construction of the site has commenced.
Final Thoughts
Overall, Lendlease REIT’s FY2023 results were great but could have been better. As mentioned above, with the huge growth in Gross Revenue and NPI, it is quite disappointing to see the DPU decrease due to the increase in the cost of debt. Hopefully, Lendlease REIT’s management will work towards aggressively lowering the aggregate leverage and increasing the percentage in fixed rates to help provide more stability for the REIT.
Based on Lendlease REIT’s last close at S$0.59, its current valuation stands at a PB ratio of 0.797x and offers a trailing twelve-month (TTM) yield of 7.966%. This does seem rather attractive for investors as there is definitely room for the REIT to grow over the long term and you are paid a decent yield while waiting for these opportunities to arise. Additionally, Lendlease REIT has offered its shareholders an option to subscribe to its Distribution Reinvestment Plan (DRP or DRIP). The declared DRP share price is S$0.5982, which is a slight premium to its last close, making investors very unincentivized to subscribe.
Despite all this, I think investors should definitely take note and keep Lendlease REIT in their watchlist as this REIT is definitely one to watch for FY2024.
Pingback: Lendlease REIT Restructures Lease With Sky Italia in FY2023
Pingback: REIT Posts of the Week @ 2 September 2023